 SEAFDEC Southeast Asian Fisheries Development Center
OVERVIEW OF THE FISHERIES SECTOR OF SOUTHEAST ASIA IN 2020
Fish and fishery products are becoming increasingly important as primary sources of protein for many peoples in the world, most especially for those in the Southeast Asian region. During the past decade, the region’s production from capture fisheries and aquaculture had been considerably increasing. Recently, many Southeast Asian countries are among the highest producers of fish and fishery products in the world. This publication is therefore intended to provide a glimpse of the increasing contribution of Southeast Asia’s fishery and aquaculture production to the world’s food fish basket. Based on the data and statistics provided by the Southeast Asian countries for the year 2020, the SEAFDEC Secretariat compiled and analyzed the relevant information for this publication. Of the 11 countries that comprise the Southeast Asian region, namely: Brunei Darussalam, Cambodia, Indonesia, Lao PDR, Malaysia, Myanmar, Philippines, Singapore, Timor-Leste, Thailand, and Viet Nam, only ten countries are covered in this publication as Timor-Leste is not the Member Country of SEAFDEC and has not yet been providing its fishery statistics and information to the SEAFDEC Secretariat.
Total Fishery Production of Southeast Asia
Table 1. Fishery production by continent from 2016 to 2020 (million MT)*
| 2016 | 2017 | 2018 | 2019 | 2020 | |
| World | 198.9 | 206.4 | 211.9 | 213.7 | 214.1 |
| Africa | 11.5 | 12.3 | 12.4 | 12.5 | 12.2 |
| America | 20.0 | 21.4 | 24.5 | 22.4 | 22.4 |
| Asia** | 103.5 | 107.5 | 108.5 | 112.9 | 114.1 |
| Southeast Asia*** | 45.3 | 45.5 | 46.5 | 46.8 | 46.2 |
| Europe | 16.9 | 18.1 | 18.4 | 17.3 | 17.4 |
| Oceania | 1.7 | 1.6 | 1.6 | 1.8 | 1.8 |
* Source (except for Southeast Asia): FAO FishStat Plus-Universal Software for Fishery Statistical Time Series
** Excludes Southeast Asia
*** Source: Fishery Statistical Bulletin of Southeast Asia (SEAFDEC, 2023)
As shown in Table 2, the fishery production of Southeast Asia from 2016 to 2019 exhibited a continuous increasing trend especially in terms of quantity although the increase in terms of value were quite unstable, and the fishery production in terms of quantity and value slightly decreased in 2020. The annual average increase in quantity from 2016 to 2020 was about 0.5 %, while the annual average rate of increase of the value was about 5.0 %. However, since some countries were not able to provide the value of their respective fishery production for 2020, such figures could be indicative only. Nevertheless, the figures still imply that in addition to the increasing quantity, most of the regional fishery commodities harvested were of high value. By country, Indonesia reported the highest fishery production in 2020 in terms of quantity accounting for about 47.2 % of the total fishery production of Southeast Asia, followed by Viet Nam contributing about 18.7 %, and Myanmar at 13.0 %. The Philippines ranked fourth accounting for 9.5 %, Thailand at 5.2 %, Malaysia at 3.9 %, and Cambodia at 2.0 %. The contributions of Lao PDR, Brunei Darussalam, and Singapore to the fishery production of Southeast Asia in 2020 were minimal in terms of quantity.
In terms of value, Indonesia accounted for about 51.8 % of the total value of the region’s fishery production with Myanmar emerging second contributing about 20.1 %, and the Philippines came in third contributing about 10.8 %. Meanwhile, Thailand which ranked fourth in terms of quantity and value contributed about 10.4 %, and Malaysia which ranked fifth in terms of production quantity as well as value accounted for 6.7 %. The trend of the fishery production of the Southeast Asian countries in 2016–2020 is shown in Figure 1.
Table 2. Total fishery production of Southeast Asia by quantity and value (2016-2020)
| Fishery Production | 2016 | 2017 | 2018 | 2019 | 2020 |
| Quantity (MT) |
45,336,010 | 45,496,587 | 46,539,195 | 46,766,274 | 46,223,147 |
| Value (US$ 1,000) |
41,155,302* | 50,564,226* | 51,811,317* | 55,045,395* | 48,650,184* |
* Data not available from Cambodia, Lao PDR and Viet Nam
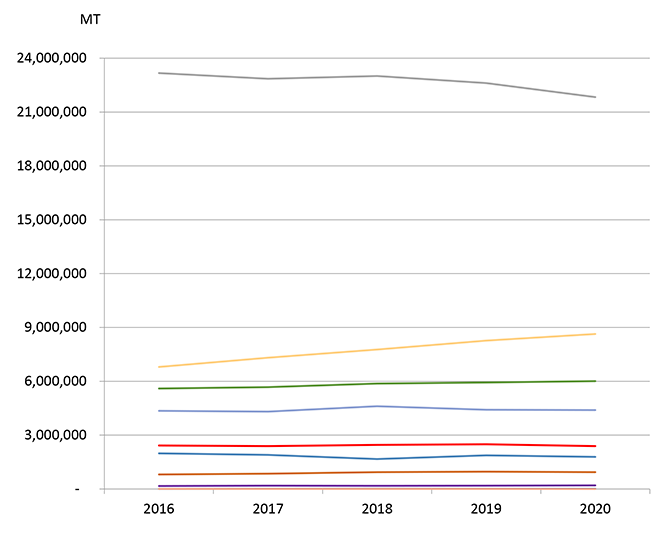
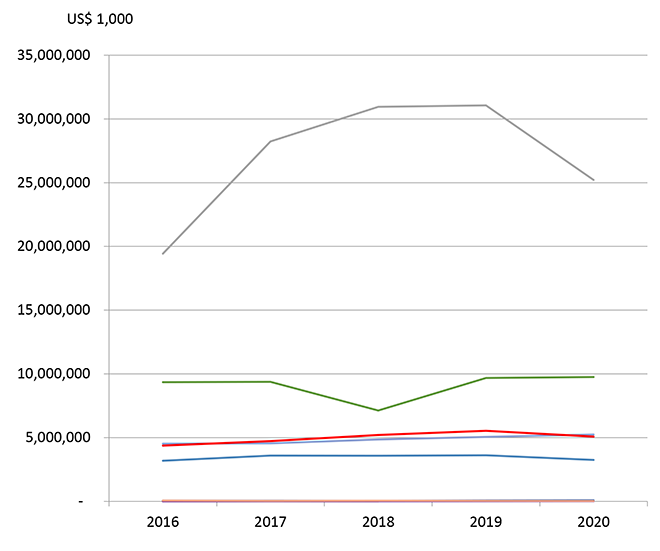
Figure 1. Fishery production of the Southeast Asian countries in 2016–2020 by quantity (MT) (left) and value (US$ 1,000) (right)
The fishery production of Southeast Asia was categorized into three subsectors, namely: marine capture fisheries, inland capture fisheries, and aquaculture. By subsector, the total fishery production of the region in 2020 as shown in Table 3 and Figure 2 indicated that the largest portion of the production quantity was derived from aquaculture accounting for approximately 54 %, followed by marine capture fisheries at about 39 %, and inland capture fisheries at 7 %. In terms of production value, marine capture fisheries accounted for 51 %, aquaculture at 41 %, and inland capture fisheries at 8 %. While the value per metric ton of marine capture fishery production was about US$ 1,705/MT, those from inland capture fisheries and aquaculture were about US$ 1,677/MT and US$ 1,022/MT, respectively. This implies that the global market had started to recognize the value of aquatic products from inland capture fisheries, and had been patronizing such products lately.
Table 3. Production of fishery subsectors of Southeast Asia in 2020 by quantity (MT) and value (US$ 1,000)
| Sub-sector | Quantity (MT) |
Value* (US$ 1,000) |
Value/Quantity** (US$/MT) |
| Marine capture fisheries | 18,216,855 | 24,547,054 | 1,705 |
| Inland capture fisheries | 3,059,714 | 3,991,213 | 1,677 |
| Aquaculture | 24,946,578 | 20,111,917 | 1,022 |
| Total | 46,223,147 | 48,650,184 |
* Data not available from Cambodia, Lao PDR and Viet Nam
** Computation of price excludes corresponding quantity production from Cambodia, Lao PDR, and Viet Nam
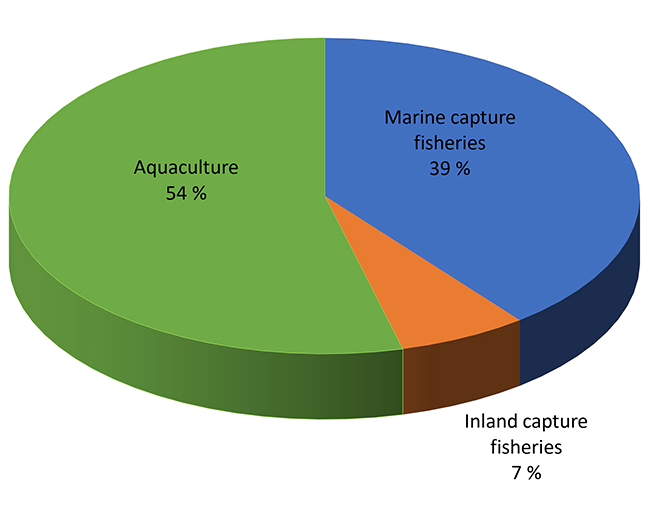
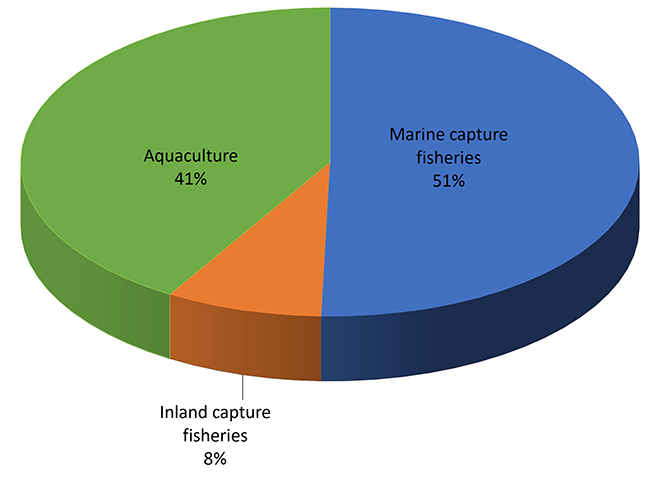
Figure 2. Proportion (%) of production of fishery subsectors of Southeast Asia in 2020 by quantity (left) and value (right))
Marine Capture Fishery Production of Southeast Asia
Table 4. Marine capture fishery production of Southeast Asia in 2016–2020 by quantity (MT) and value (US$ 1,000)
| Marine capture fishery production | 2016 | 2017 | 2018 | 2019 | 2020 |
| Quantity (MT) | 17,027,312 | 17,330,277 | 18,330,325 | 18,167,839 | 18,216,855 |
| Value (US$ 1,000) | 19,939,678* | 25,292,021* | 28,122,606* | 29,343,867* | 24,547,054* |
* Data not available from Cambodia and Viet Nam
In terms of quantity, the total production from marine capture fisheries of the Southeast Asian countries during 2016–2020 indicated that Indonesia contributed the highest quantity to the region’s total production. Specifically, in 2020, Indonesia’s production was 6.49 million MT accounting for approximately 35.6 % of the region’s total, followed by Viet Nam at 3.70 million MT (20.3 %), Myanmar at 3.26 million MT (17.9 %), and Philippines at 1.9 million MT (10.6 %). Malaysia and Thailand also produced a considerable quantity of aquatic commodities from marine capture fisheries at 1.38 million MT (7.6 %) and 1.31 million MT (7.2 %), respectively. A picture of the region’s production quantity from marine capture fisheries in 2020 could be gleaned from Figure 3.
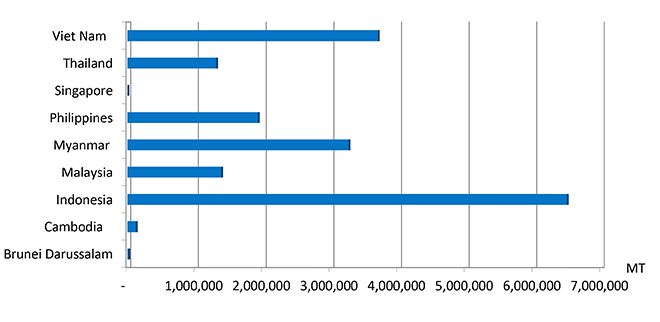
Figure 3. Marine capture fishery production of the Southeast Asian countries in 2020 by quantity (MT)
Although some Southeast Asian countries, i.e. Cambodia and Viet Nam, were not able to provide the value of their production from marine capture fisheries, the trend of the total value of the region’s marine capture fishery production from 2016 to 2019 seemed to have increased corresponding to the increasing trend of the region’s production quantity. By country, Indonesia which led the Southeast Asian countries, accounted for about 49.4 % of the region’s marine capture fishery production value in 2020, with Myanmar emerging second contributing about 21.9 %. Meanwhile, the Philippines which came in third in terms of value contributed about 10.9 %, Malaysia came in fourth at 9.8 %, and lastly, Thailand contributed about 7.7 %.
Aggregating the 2020 production quantity from marine capture fisheries by major commodity groups (Table 5), marine fishes provided the highest quantity accounting for about 86.4 %, followed by mollusks at 5.5 % while crustaceans, seaweeds, and invertebrates contributed 4.7 %, 0.4 %, and 0.01 %, respectively. It should be noted that 3.1 % was contributed by other commodity groups which could not be appropriately classified as some countries were not able to provide their respective production quantity by species. In 2020, the production quantity of invertebrates, seaweeds, and marine fishes had decreased from that of 2019 by about 96.6 %, 5.1 %, and 0.9 %, respectively, but the production quantity of others, mollusks, and crustaceans had increased by about 43.5 %, 6.0 %, and 0.4 %, respectively, compared with the corresponding quantity in 2019.
Table 5. Production of the major commodity groups from marine capture fisheries of Southeast Asia in 2016–2020 by quantity (MT)
| Commodity Group | 2016 | 2017 | 2018 | 2019 | 2020 |
| Marine fishes | 14,726,719 | 14,880,726 | 15,974,939 | 15,870,138 | 15,733,257 |
| Crustaceans | 708,248 | 718,355 | 765,095 | 859,449 | 862,655 |
| Mollusks | 540,958 | 830,724 | 564,974 | 940,461 | 996,996 |
| Seaweed | 41,457 | 47,271 | 44,383 | 67,848 | 64,414 |
| Invertebrates | 105,886 | 92,901 | 113,482 | 40,140 | 1,362 |
| Others | 904,044 | 760,300 | 867,452 | 389,803 | 559,533 |
| Total marine capture fishery production | 17,027,312 | 17,330,277 | 18,330,325 | 18,167,839 | 18,216,855 |
Comparing the quantity of the total fishery production in 2020 with that of 2019, an increase in the production of the marine capture fishery is obvious, which could have been influenced by various factors that include: increased production of various major commodities of Viet Nam such as tuna-like fishes nei (Scrombroidei), natantian decapods nei (Natantia), and cephalopods nei (Cephalopoda) from Fishing Area 711; production of major marine capture fishery of Indonesia that also increased considerably, especially jacks, crevalles nei (Caranx spp.), scads nei (Decapterus spp.), banana prawn (Penaeus merguiensis), giant tiger prawn (Penaeus monodon), Metapenaeus shrimps nei (Metapenaeus spp.) from Fishing Area 572 and 71; and increased production of Myanmar of marine fishes nei from Fishing Area 57.
1 Fishing area 57 covers the marine fishing areas of Myanmar, Thailand (Indian Ocean), Malaysia (West Coast of Peninsula Malaysia), and Indonesia (Malacca Striat, West Sumatra and South Java, Bali-Nusa Tenggara)
2 Fishing area 71 covers the marine fishing areas of Thailand (Gulf of Thailand), Cambodia, Viet Nam (Southwest and Southest), Malaysia (East Coast of Peninsula Malaysia, Sabah, Sarawak), Singapore, Brunei Darussalam, Philippines (Luzon, Visayas, Mindanao), and Indonesia (East Sumatra, North Java, Bali-Nusa Tenggara, Southwest Kalimantan, East Kalimantan, South Sulawesi, North Sulawesi, Maluku-Papua)
Moreover, the region’s production of major species such as the skipjack tuna (Katsuwonus pelamis) and yellowfin tuna (Thunnus albacares) decreased in 2020 compared with that 2019 which could have been influenced by the reduced production of Indonesia, Philippines, and Malaysia; narrow-barred Spanish mackerel (Scomberomorus commerson) production also decreased in 2020 compared with that of 2019 which could have been influenced by decreased production of the Philippines. Meanwhile, production of Natantian decapods nei in 2020 had increased compared with that of 2019, which could have been brought about by increased production of Cambodia and Viet Nam from Fishing Area 71.
The commercially-important marine species that provided a sizeable contribution to the total fishery production of Southeast Asia from marine capture fisheries by quantity and value in 2020 are shown in Table 6. The data indicate that miscellaneous marine fishes (unidentified) contributed the highest quantity at about 42.85 % and value at about 33.56 %. Production from the tunas and tuna-like species group contributed about 14.30 % to the total production quantity and ranked second and value accounting for about 16.78 % of the total production value, followed by the scads group contributed about 8.96 % to the total production quantity and value of about 9.59 % of the total production value.
The data in Table 6 also suggest that the production value/quantity of seerfishes nei (Scomberomorus spp.) is valued the highest among the commodities harvested through marine capture fisheries at US$ 4,962/MT followed by Southern bluefin tuna (Thunnus maccoyii) at US$ 4,433/MT, then crustaceans group at US$ 3,696/MT, narrow-barred Spanish mackerel (Scomberomorus commerson) at US$ 3,047/MT, mollusks group at US$ 2,823/MT, bigeye tuna (Thunnus obesus) at US$ 2,790/MT, Indo-Pacific king mackerel (Scomberomorus guttatus) at US$ 2,777/MT, yellowfin tuna (Thunnus albacares) at US$ 2,397/MT, albacore tuna (Thunnus alalunga) at US$ 2,346/MT, Tuna-like fishes nei (Scombroidei) at US$ 2,322/MT, Jacks, crevalles nei (Caranx spp.) at US$ 2,302/MT, Indian mackerels nei (Rastrelliger spp.) at US$ 1,907/MT, short mackerel (Rastrelliger brachysoma) at US$ 1,787/MT, and Indian mackerel (Rastrelliger kanagurta) at US$ 1,755/MT. The average value of miscellaneous marine fishes (unidentified) which contributed the highest quantity in 2020 was estimated at US$ 1,495/MT.
Table 6. Production of commercially-important species from marine capture fishery of Southeast Asia in 2020 by quantity (MT) and value (US$)
| Group/Species | Quantity (MT) | Percentage in total quantity of marine capture production (%) |
Value (US$1,000)* |
Percentage in total value of marine capture production (%) |
Value/ Quantity (US$/MT)** |
| Tunas and Tuna-like species | 2,604,183 | 14.30 | 4,120,095 | 16.78 | 1,868 |
| Neritic tunas | 823,311 | 1,154,835 | 1,424 | ||
| Frigate tuna | 349,331 | 541,081 | 1,549 | ||
| Bullet tuna | 7,177 | 8,463 | 1,179 | ||
| Kawakawa | 223,339 | 274,132 | 1,299 | ||
| Longtail tuna | 243,464 | 331,159 | 1,360 | ||
| Oceanic tunas | 1,160,787 | 2,174,781 | 1,897 | ||
| Skipjack tuna | 736,865 | 1,157,820 | 1,571 | ||
| Albacore tuna | 7,289 | 14,131 | 2,346 | ||
| Southern bluefin tuna | 1,298 | 5,754 | 4,433 | ||
| Yellowfin tuna | 326,208 | 764,324 | 2,397 | ||
| Bigeye tuna | 89,127 | 232,752 | 2,790 | ||
| Tuna-like species | 620,085 | 790,479 | 3,187 | ||
| Narrow-barred Spanish mackerel | 185,376 | 564,819 | 3,047 | ||
| Indo-Pacific king mackerel | 34,815 | 96,668 | 2,777 | ||
| Seerfihes nei | 24,373 | 120,950 | 4,962 | ||
| Tune-like fishes nei | 375,521 | 8,042 | 2,322 | ||
| Scads | 1,631,789 | 8.96 | 2,353,888 | 9.59 | 1,443 |
| Bigeye scad | 228,492 | 370,112 | 1,620 | ||
| Yellowstripe scad | 132,115 | 195,754 | 1,482 | ||
| Torpedo scad | 90,181 | 107,369 | 1,191 | ||
| Indian scad | 124,976 | 142,435 | 1,140 | ||
| Scad nei | 757,367 | 915,477 | 1,209 | ||
| Jacks, crevalles nei | 181,220 | 417,117 | 2,302 | ||
| Carangids nei | 117,438 | 205,624 | 1,751 | ||
| Mackerels | 406,528 | 2.23 | 728,464 | 2.97 | 1,792 |
| Short mackerel | 54,971 | 98,209 | 1,787 | ||
| Indian mackerel | 172,597 | 302,860 | 1,755 | ||
| Indian mackerels nei | 76,653 | 146,208 | 1,907 | ||
| Mackerels nei | 102,307 | 181,187 | 1,771 | ||
| Anchovies | 250,215 | 1.37 | 232,668 | 0.95 | 930 |
| Stolephorus anchovies | 108,616 | 161,278 | 1,485 | ||
| Other anchovies | 141,599 | 71,390 | 504 | ||
| Sardines | 723,476 | 3.97 | 499,943 | 2.04 | 691 |
| Spotted sardinella | 27,462 | 28,483 | 1,037 | ||
| Goldstripe sardinella | 152,072 | 148,357 | 976 | ||
| Bali sardinella | 402,361 | 224,780 | 559 | ||
| Rainbow sardines | 28,784 | 30,683 | 1,066 | ||
| Sardinellas nei | 112,797 | 67,640 | 600 | ||
| Crustaceans | 654,995 | 3.60 | 2,213,692 | 9.02 | 3,696 |
| Molluscs | 840,239 | 4.61 | 1,776,716 | 7.24 | 2,823 |
| Marine fishes unidentified | 7,806,010 | 42.85 | 8,239,095 | 33.56 | 1,495 |
* Data not available from Cambodia and Viet Nam
** Computation of price excludes corresponding quantity production from Cambodia and Viet Nam
Inland Capture Fishery Production of Southeast Asia
While the most Southeast Asian countries (except Brunei Darussalam and Singapore) reported their respective data on production from inland capture fisheries during 2016–2020, only five countries , i.e. Indonesia, Malaysia, Myanmar, Philippines, and Thailand, reported the corresponding production values. Thus, the actual regional production trend of the inland capture fisheries subsector could not be established. At any rate, as the consistent top producer, Myanmar maintains a stable inland fishery production from 2016 to 2020 that accounted for 33.0 % of the country’s total production from capture fisheries, 26.7 % of the country’s total fishery production, and 3.5 % of the region’s total fishery production (Table 7). The second highest producer, Indonesia reported a production quantity of 494,950 MT in 2020 which represented 7.1 % of the country’s production from capture fisheries, 2.3 % of the country’s total fishery production, and 1.1 % of the region’s total fishery production. Meanwhile, Cambodia reported an inland production quantity of 413,200 MT in 2020 which represented 77.10 % of the country’s total production from capture fisheries, and 44.1 % of the country’s total fishery production.
Table 7. Inland capture fishery production of the Southeast Asian countries in 2020 by quantity (MT)
| Country | Inland capture production (MT) | Total capture production (MT) | % of inland capture production to total capture production | Total fishery production (MT) | % of inland capture fishery production to total fishery production |
| Brunei Darussalam | … | 13,074 | … | 16,575 | … |
| Cambodia | 413,200 | 535,900 | 77.10 | 936,300 | 44.13 |
| Indonesia | 494,950 | 6,989,090 | 7.08 | 21,834,105 | 2.27 |
| Lao PDR | 70,001 | 70,001 | 100 | 200,021 | 35.00 |
| Malaysia | 5,626 | 1,388,923 | 0.40 | 1,788,940 | 0.31 |
| Myanmar | 1,608,066 | 4,872,903 | 33.0 | 6,013,781 | 26.74 |
| Philippines | 148,415 | 2,075,758 | 7.15 | 4,398,589 | 3.37 |
| Singapore | … | 356 | … | 5,179 | … |
| Thailand | 123,256 | 1,434,064 | 8.60 | 2,393,971 | 5.15 |
| Viet Nam | 196,200 | 3,896,500 | 5.04 | 8,635,686 | 2.27 |
| Total | 3,059,714 | 21,276,569 | Ave: 14.38 | 46,223,147 | Ave: 6.62 |
It should be noted, however, that such production quantity could not be accurate considering that most of the countries still need to improve their systems of collecting and compiling their respective fishery statistics, especially with regard to their production from inland capture fisheries.
On inland capture fisheries production by species, only three countries, namely: Indonesia, Philippines, and Thailand, had provided their respective production data from inland capture fisheries by species, while the other countries were not able to report due to the inadequacy of expertise and resources in identifying and recording the catch by species. Capacity building in this aspect is, therefore, necessary to enable the countries to compile their respective inland fishery production by major groups of species. Thus, production from inland capture fisheries of Cambodia, Lao PDR, Malaysia, Myanmar, and Viet Nam in 2020 could not be analyzed in terms of species because these countries were not able to provide the breakdown of their production quantity by species.
The group of freshwater fishes nei (Osteichthyes) with no species classification provided the highest production from inland capture fisheries accounting for 75.20 % of the region’s total inland capture fisheries production in 2020 (Table 8). As for the major species, production of Nile tilapia (Oreochromis niloticus) was the highest at 2.46 %, followed by striped snakehead (Channa striata) at 1.99 %, freshwater mollusks nei (Mollusca) at 1.54 %, tilapias nei (Oreochromis (=Tilapia) spp.) at 1.32 %, silver barb (Barbonymus gonionotus) at 1.30 %, and torpedo-shaped catfishes nei (Clarias spp.) at 1.22 %. As for the production value per quantity, striped snakehead (Channa striata) was valued the highest among the commodities harvested through inland capture fisheries at US$ 2,672/MT, followed by the climbing perch (Anabas testudineus) at US$ 2,494/MT, Pangasius djambal at US$ 2,089/MT, and torpedo-shaped catfishes nei (Clarias spp.) at US$ 2,014/MT.
Table 8. Production of major species from inland capture fisheries of Southeast Asia in 2020 by quantity (MT) and value (US$ 1,000)
| Common name | Quantity (MT) |
Percentage of total quantity of inland capture production (%) | Value (US$ 1,000)* | Percentage of total value of inland capture production (%) | Value/Quantity (US$/MT)** |
| Misc. fishes | 2,300,801 | 75.20 | 2,662,196 | 66.70 | 1,566 |
| Nile tilapia | 75,141 | 2.46 | 129,932 | 3.26 | 1,729 |
| Striped snakehead | 60,979 | 1.99 | 162,943 | 4.08 | 2,672 |
| Freshwater mollusks nei | 47,137 | 1.54 | 6,067 | 0.15 | 129 |
| Tilapias nei | 40,455 | 1.32 | 53,813 | 1.35 | 1,330 |
| Silver barb | 39,909 | 1.30 | 62,689 | 1.57 | 1,571 |
| Torpedo-shaped catfishes nei | 37,378 | 1.22 | 75,292 | 1.89 | 2,014 |
| Climbing perch | 35,023 | 1.14 | 87,348 | 2.19 | 2,494 |
| Snakeskin gourami | 31,208 | 1.02 | 51,379 | 1.29 | 1,646 |
| Cyprinidae | 26,563 | 0.87 | 23,694 | 0.59 | 1,538 |
| Pangasius djambal | 25,586 | 0.84 | 53,448 | 1.34 | 2,089 |
* Data not available from Cambodia, Lao PDR, and Viet Nam
** Computation of price excludes corresponding quantity production from Cambodia, Lao PDR, and Viet Nam
Aquaculture Production of Southeast Asia
For Indonesia as the largest producer of aquaculture products in 2020, the production of Eucheuma seaweeds nei (Eucheuma spp.) contributed 54.43 % to the production quantity and 13.58 % to the production value of the country’s aquaculture production. This was followed by Gracilaria seaweeds nei (Gracilaria spp.) accounting for 9.81 %, Nile tilapia (Oreochromis niloticus) at 7.21 %, and torpedo-shaped catfishes (Clarias spp.) at 6.69 %. In the case of Viet Nam as the second-highest producer from aquaculture, 31.53 % of its aquaculture production came from striped catfish (Pangasianodon hypophthalmus), followed by freshwater fishes nei (Osteichthyes) at 14.88 %, whiteleg shrimp (Penaeus vannamei) at 13.0 %, cyprinids nei (Cyprinidae) at 9.75 %, and freshwater fishes nei (Osteichthyes) at 8.92 % of the country’s aquaculture production.
For the Philippines as the third-highest aquaculture producer, its main aquaculture product was elkhorn sea moss (Kappaphycus alvarezii) contributing 60.47 % to the country’s production from aquaculture, followed by milkfish (Chanos chanos) at 16.91 %, Nile tilapia (Oreochromis niloticus) at 6.86 %, Tilapia nei (Oreochromis (=Tilapia) spp.) at 3.70 %, and spiny eucheuma (Eucheuma denticulatum) at 2.71 %.
For Myanmar, the main production from aquaculture was roho labeo (Labeo rohita) which accounted for 60.27 % of the country’s production from aquaculture, followed by silver barb (Barbonymus gonionotus) common carp (Cyprinus carpio) at 15.36 %, and common carp (Cyprinus carpio) at 10.78 %. The main aquaculture product of Thailand was whiteleg shrimp (Penaeus vannamei) accounting for 32.29 % of the country’s aquaculture production , followed by Nile tilapia (Oreochromis niloticus) at 21.46 %, hybrid catfishes (C. gariepinus x C. macrocephalus) at 10.35 %, and green mussel (Perna viridis) at 7.16 %.
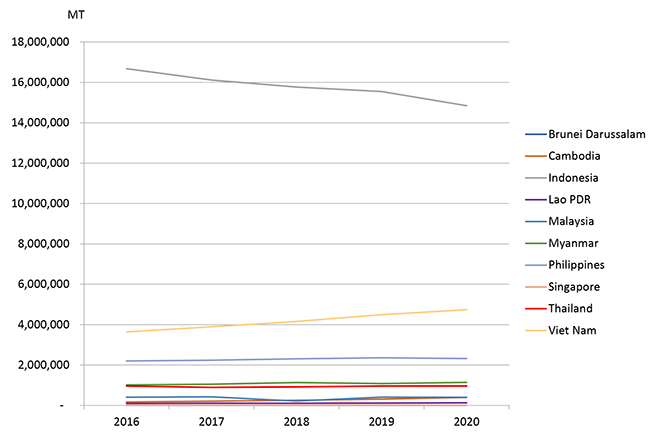
Figure 4. Trend of the aquaculture production (MT) of the Southeast Asian countries from 2016 to 2020
In terms of the value of the region’s aquaculture production, the actual trend could not be established as some countries could not report their data regularly. For the available data in 2020, Brunei Darussalam attained the highest value/quantity at US$ 7,504/MT followed by Singapore at US$ 5,766/MT, Thailand at US$ 3,074/MT, Malaysia at US$ 2,067/MT, Myanmar at US$ 1,648/MT, Philippines at US$ 1,023/MT, and Indonesia at US$ 810/MT. Meanwhile, the value of aquaculture production of Cambodia, Lao PDR, and Viet Nam in 2020 could not be calculated as their respective total production values were not reported.
The aquaculture production was categorized based on three culture environments, namely: mariculture, brackishwater culture, and freshwater culture. In 2020, Indonesia was the top producer of aquaculture products in the Southeast Asian region and had the highest production from mariculture, followed by Viet Nam from freshwater culture, Philippines from mariculture, Myanmar from freshwater culture, and Thailand from brackishwater culture. In terms of quantity, mariculture contributed 43.0 % of the region’s total aquaculture production in 2020 while brackishwater culture contributed 22.0 %, and the remaining 35.0 % came from freshwater culture. In terms of value, mariculture contributed 13.0 %, freshwater aquaculture production contributed 40.0 %, and brackishwater culture production contributed the highest at 47.0 % (Figure 5).
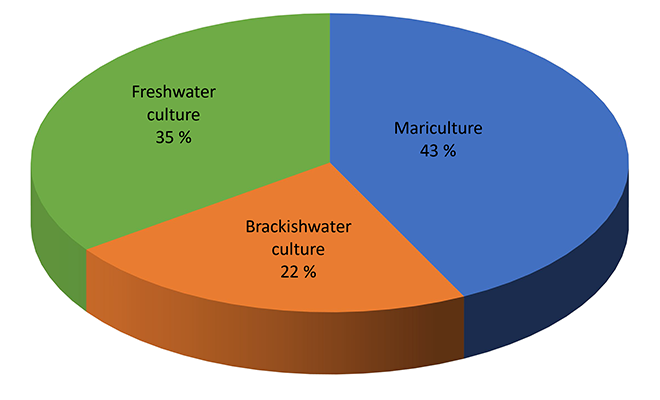
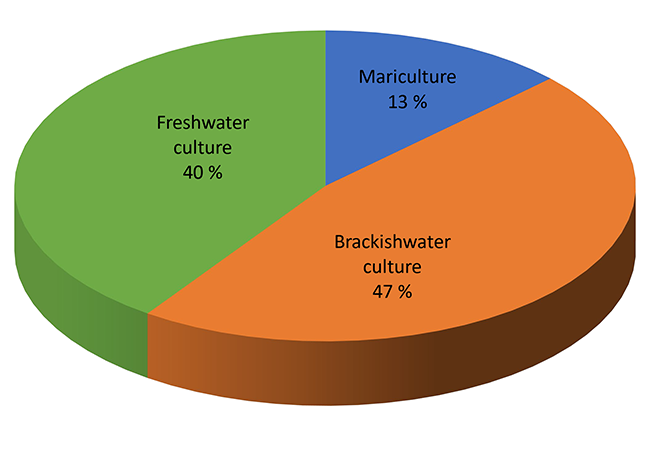
Figure 5 Proportion (%) of aquaculture production by culture environment of Southeast Asia in 2020 by quantity (left) and value (right))
It should be recalled that in 2019, the production in terms of quantity from mariculture accounted for 44.0 % of the total aquaculture production, while brackishwater culture production accounted for 20.0 % and freshwater culture production at 36.0 %. In terms of value, mariculture contributed 15.0 % to the region’s total aquaculture production value, brackishwater culture production at 42.0 %, and freshwater culture production at 43.0 %. In 2020, the production quantity from freshwater culture slightly decreased by 4.8 % compared with that of 2019, which could be due to the decreased quantity of production of the Philippines, Singapore, Thailand, and Viet Nam. Meanwhile, the production value from brackishwater culture slightly increased by 2.1 % from of 2019 which could be due to the increased production of whiteleg shrimp (Penaeus vannamei) of Brunei Darussalam and roho labeo (Labeo rohita) of Myanmar.
Mariculture
In 2020, the region’s total production in terms of quantity from mariculture contributed about 43.0 % to the region’s total aquaculture production but only 13.0 % in terms of value. Farmed aquatic plants, such as Eucheuma seaweeds (Eucheuma spp.) and elkhorn sea moss (Kappaphycus alvarezii), contributed 91.5 % to the region’s total mariculture production quantity. The Eucheuma seaweeds production of Indonesia accounted for about 76.0 % of the region’s total production quantity from mariculture, followed by elkhorn sea moss as the main mariculture product of the Philippines which accounted for 13.2 %. The marine mollusks group contributed about 3.2 % to the region’s total mariculture production quantity, with Viet Nam providing the highest production of marine mollusks nei, followed by Thailand whose production of green mussels (Perna viridis) and blood cockle (Anadara granosa) contributed about 0.65 % and 0.32 %, respectively (Figure 6).
In terms of value, Eucheuma spp. contributed 63.4 % to the region’s total mariculture production followed by milkfish (Chanos chanos) which contributed about 13.7 %, Kappaphycus alvarezii contributed about 8.2%, and Anadara granosa contributed about 5.7 % (Figure 6).
For value per quantity, milkfish commanded the highest value per quantity at US$ 2,336/MT, followed by blood cockle at US$ 2,316/MT, and marine molluscs nei at US$ 1,340/MT. Meanwhile, the lowest value was US$ 132/MT for spiny Eucheuma (Table 9).
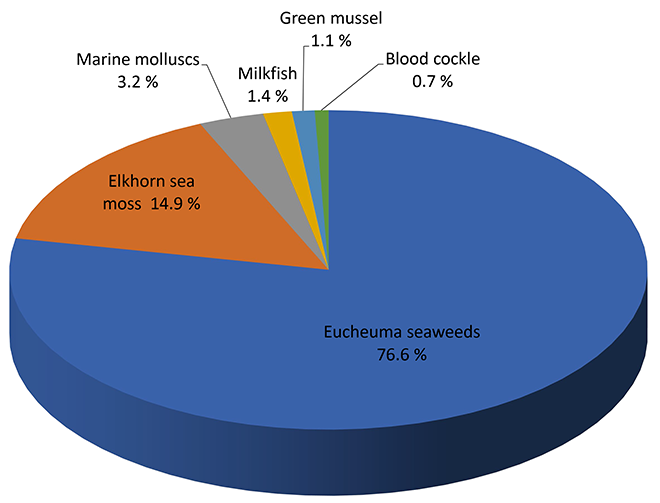
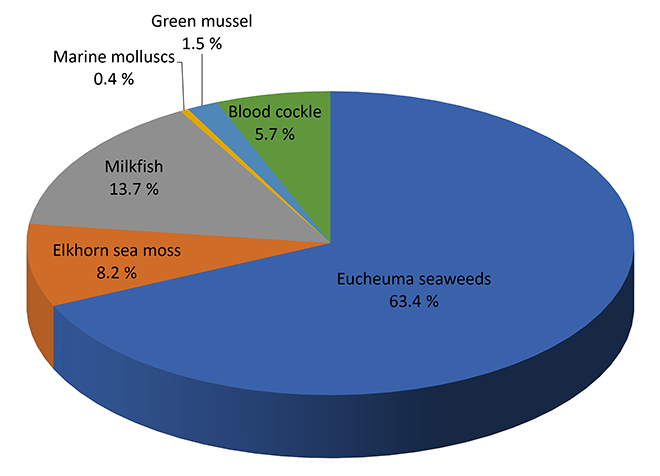
Figure 6. Proportion (%) of production of major species from mariculture of Southeast Asia in 2020 by quantity (left) and value (right)
Table 9. Production of major species from mariculture of Southeast Asia in 2020 by quantity (MT) and value (US$ 1,000)
| Common name | Quantity (MT) |
Percentage production in the total mariculture production (%) |
Value (US$ 1,000) | Percentage in total mariculture value (%) |
Value/Quantity (US$/MT)** |
| Eucheuma seaweeds nei | 8,081,796 | 76.0 | 1,632,570 | 63.1 | 202 |
| Elkhorn sea moss | 1,587,737 | 14.9 | 211,805 | 8.2 | 133 |
| Marine mollusks nei | 343,871 | 3.2 | 10,813 | 0.4 | 1,340 |
| Milkfish | 151,750 | 1.4 | 354,537 | 13.7 | 2,336 |
| Green mussel | 119,917 | 1.1 | 40,064 | 1.5 | 353 |
| Japanese Sargasso seaweed | 80,662 | 0.8 | 26,716 | 1.0 | 331 |
| Blood cockle | 72,712 | 0.7 | 147,122 | 5.7 | 2,316 |
| Oysters | 68,916 | 0.6 | 36,010 | 1.4 | 522 |
| Spiny eucheuma | 63,073 | 0.6 | 8,323 | 0.3 | 132 |
As for value per quantity of mariculture production in the respective countries, Brunei Darussalam posted the highest at an average of US$ 7,893/MT from its production of (Panulirus polyphagus), and Myanmar at US$ 3,597/MT for its production of highly economic groupers nei (Epinephelus spp.), followed by Singapore at US$ 4,974/MT for mud spiny lobster barramundi (=giant seaperch) (Lates calcarifer). Meanwhile, the mariculture production value of Thailand was at US$ 1,162/MT, Philippines at US$ 357/MT, Indonesia at US$ 218/MT, and Malaysia at US$ 173/MT.
Brackishwater Culture
The total production from brackishwater aquaculture in 2020 represented about 22 % of the region’s total aquaculture production. The major groups and species cultured in brackishwater include aquatic plants such as Gracilaria spp., crustaceans such as banana prawn (Penaeus merguiensis), giant tiger shrimp (P. monodon), whiteleg shrimp (P. vannamei), and other shrimps, as well as fishes such as milkfish (Chanos chanos) and marine fishes, and others (Figure 7). The production of whiteleg shrimps (Penaeus vannamei) was mainly produced by Indonesia, Viet Nam, and Thailand, and had the highest quantity contributing 31.1% of the region’s total production from brackishwater aquaculture. The second highest was Gracilaria seaweeds (Gracilaria spp.) at 26.2 % mainly produced by Indonesia, and the third was milkfish (Chanos chanos) at 19.2 % mainly produced by Indonesia and Philippines. Meanwhile, giant tiger prawn (Penaeus monodon) mainly from Viet Nam and Indonesia contributed 9.4 %; group of fishes was 9.1 %; and shrimps at 1.9 %. It should be noted that despite the COVID-19 pandemic, Brunei Darussalam had a drastic increase in brackishwater culture production since 2020 due to the change in national policy that allowed the culture of whiteleg shrimps.
In terms of production value, whiteleg shrimp (P. vannamei) contributed the highest value of about 52.9 % which was produced by Indonesia and Thailand, followed by milkfish (Chanos chanos) from Indonesia and Philippines contributing at 16.9 %, giant tiger shrimp (P. monodon) from Indonesia, Myanmar, Philippines, Thailand, and Malaysia at 19.1 %, and marine fishes at 3.7 %. Although aquatic plants attained the second highest production quantity (26.2 %), the contribution in terms of value was only 1.2 % (Figure 7).
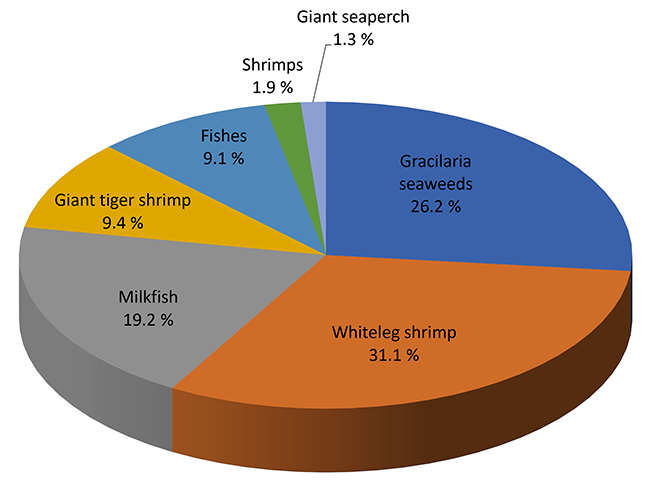
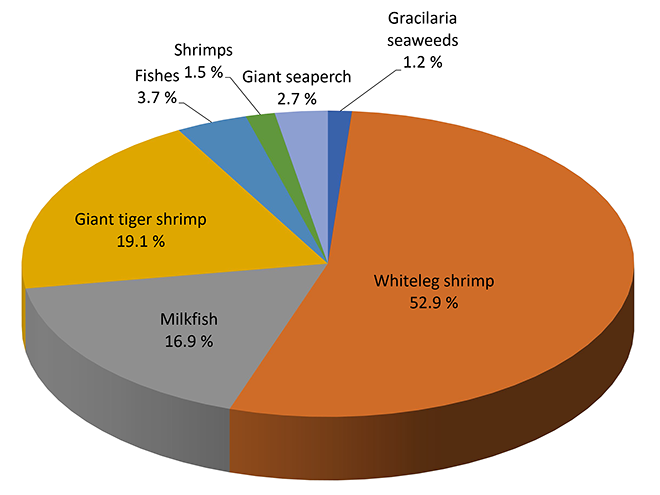
Figure 7. Proportion (%) of production of major species from brackishwater culture of Southeast Asia in 2020 by quantity (left) and value (right)
The highest value per quantity of production was attained by the giant tiger shrimp (P. monodon) at US$ 6,836/MT followed by whiteleg shrimp (P. vannamei) at US$ 4,414/MT, giant seaperch at US$ 3,590/MT, other shrimps at US$ 2,617/MT, group of fishes at US$ 1,700/MT, milkfish (Chanos chanos) at US$ 1,473/MT, and Gracilaria spp. at US$ 80/MT (Table 10). Singapore posted the highest value per quantity of production at US$ 12,147/MT, followed by Myanmar at US$ 7,654/MT, Brunei Darussalam at US$ 7,542/MT, Malaysia at US$ 5,617/MT, Thailand at US$ 4,654/MT, Philippines at US$ 3,656/MT, and Indonesia at US$ 1,563/MT. However, Cambodia and Viet Nam could not report their respective production values from brackishwater aquaculture.
Table 10. Production of major species from brackishwater culture in Southeast Asia in 2019 by quantity (MT) and value (US$)
| Common name | Quantity (MT) |
Percentage in total brackishwater culture production quantity(%) |
Value (US$ 1,000)* |
Percentage in total brackishwater culture value (%) |
Value/Quantity (US$/MT)** |
| Whiteleg shrimps | 1,744,856 | 31.1 | 4,981,946 | 52.9 | 4,414 |
| Gracilaria seaweeds | 1,468,757 | 26.2 | 116,720 | 1.2 | 80 |
| Milkfish | 1,079,223 | 19.2 | 1,590,197 | 16.9 | 1,473 |
| Giant tiger shrimp | 526,512 | 9.4 | 1,800,403 | 19.1 | 6,836 |
| Misc. fishes | 511,862 | 9.1 | 350,061 | 3.7 | 1,700 |
| Shrimps | 105,133 | 1.9 | 142,248 | 1.5 | 2,617 |
| Giant seaperch | 72,654 | 1.3 | 257,272 | 2.7 | 3,590 |
* Data not available from Cambodia and Viet Nam
** Computation of price excludes corresponding quantity production from Cambodia and Viet Nam
Freshwater Culture
The region’s total production from freshwater culture in 2020 accounted for about 35.0 % of the region’s total aquaculture production quantity, which was a slight decrease of about 4.8 % from 2019. In 2020, Indonesia had the highest production from freshwater aquaculture at 3,390,976 MT or 39.0 % of the region’s total freshwater aquaculture production, followed by Viet Nam at 2,934,233 MT or 33.7 %, Myanmar at 1,078,312 MT or 12.4 %, Thailand at 405,656 MT or 4.7 %, Cambodia at 379,780 MT or 4.4 %, Philippines at 284,917 MT or 3.3 %, Lao PDR at 1130,020 MT or 1.5 %, and Malaysia at 97,210 MT or 1.1 %.
Having accounted for 40.0 % of the region’s total aquaculture production value in 2020, freshwater aquaculture emerged to be crucial, notwithstanding the decrease of its production value by almost 10.8 % in 2020 compared with that of 2019. This information, however, could be underestimated considering that the corresponding production values from Cambodia, Lao PDR, and Viet Nam had not yet been reported.
In terms of the production quantity of the Southeast Asian countries by species (Figure 8), striped catfish (Pangasianodon hypophthalmus) accounted for 17.3 % of the region’s total production from freshwater aquaculture, which was contributed mainly by Viet Nam. This was followed by Nile tilapia (Oreochromis niloticus) which accounted for 17.1 % and contributed mainly by Indonesia, followed by torpedo-shaped catfishes (Clarias spp.) at 12.4 % contributed mainly by Indonesia, a group of freshwater fishes at 9.9 % contributed mainly by Viet Nam, common carp (Cyprinus carpio) at 9.7 % contributed mainly by Indonesia, Myanmar, and Viet Nam, roho labeo (Labeo rohita) at 8.1 % contributed mainly by Myanmar, Cyprinids nei at 5.9 % contributed mainly by Viet Nam, tilapias nei (Oreochromis(=Tilapia) spp.) for 5.3 % contributed mainly by Viet Nam, pangas catfishes nei (Pangasius spp.) accounted for 5.1 % mainly by Indonesia and Cambodia, silver barb (Barbonymus gonionotus) at 3.3 % mainly by Myanmar and Cambodia, giant gourami (Osphronemus goramy) accounted for 1.7 % contributed mainly by Indonesia, and Africa-bighead catfish, hybrid (Clarias gariepinus x C. macrocephalus) at 1.1 % contributed mainly by Thailand.
On the production value, the highest contributor to the region’s total production value from freshwater aquaculture in 2020 was Nile tilapia (Oreochromis niloticus) which accounted for 29.5 % of the region’s total production from freshwater aquaculture, followed by torpedo-shaped catfishes (Clarias spp.) at 15.2%, common carp (Cyprinus carpio) at 14.7 %, roho labeo (Labeo rohita) at 11.2 %, a group of freshwater fishes at 6.2 %, pangas catfishes nei (Pangasius spp.) at 5.4 %, giant gourami (Osphronemus goramy) at 4.3%, giant river prawn (Macrobrachium rosenbergii) at 3.90 %, and tilapias nei (Oreochromis(=Tilapia) spp.) at 3.2 %. For the value per quantity of major freshwater aquaculture species, the highest was earned by giant river prawn (Macrobrachium rosenbergii) at US$ 7,061/MT followed by giant gourami (Osphronemus goramy) at US$ 2,350/MT, striped catfish (Pangasianodon hypophthalmus) at US$ 2,262/MT, tilapias nei (Oreochromis(=Tilapia) spp.) at US$ 1,775/MT, common carp (Cyprinus carpio) at US$ 1,742/MT, Nile tilapia (Oreochromis niloticus) at US$ 1,664/MT, a group of freshwater fishes at US$ 1,645/MT, Africa-bighead catfish, hybrid (Clarias gariepinus x C. macrocephalus) at US$ 1,465/MT, pangas catfishes nei (Pangasius spp.) at US$ 1,349/MT, roho labeo (Labeo rohita) at US$ 1,304/MT, torpedo-shaped catfishes (Clarias spp.) at US$ 1,202/MT, silver barb (Barbonymus gonionotus) at US$ 1,043/MT, striped catfish (Pangasianodon hypophthalmus) at US$ 886/MT, and cyprinids nei at US$ 376/MT (Table 11).
Furthermore, for the value of major freshwater cultured species by country, Singapore presented the highest average value at US$ 7,848/MT mainly from its production of the mozambique tilapia (Oreochromis mossambicus). This was followed by Brunei Darussalam at US$ 5,936/MT mainly for its production of the mozambique tilapia, Malaysia at US$ 2,338/MT mainly for its production of torpedo-shaped catfishes (Clarias spp.), Thailand at US$ 1,939/MT mainly for its production of Nile tilapia (O. niloticus), Philippines at US$ 1,771/MT for its production of Nile tilapia also, Indonesia at US$ 1,529/MT mainly for its production of Nile tilapia, and Myanmar at US$ 1,300/MT mainly for its production of the roho labeo (Labeo rohita).
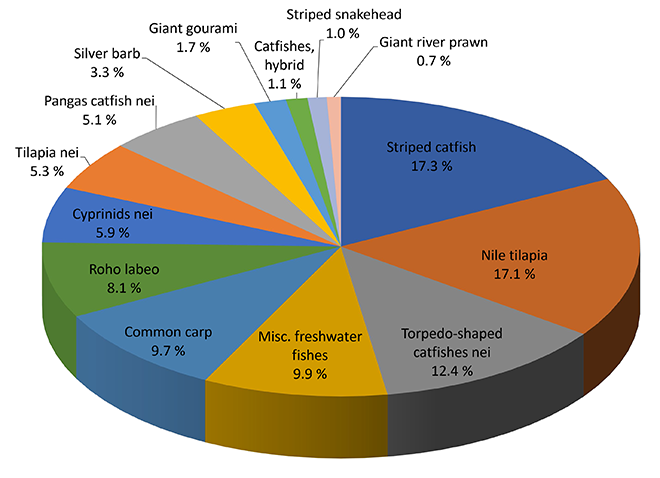
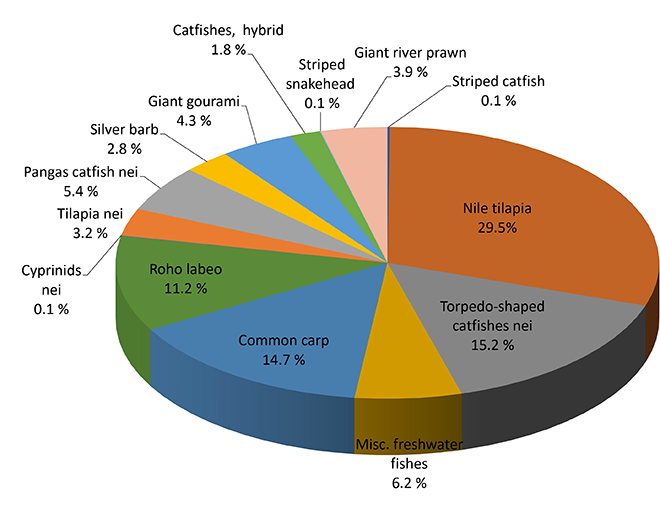
Figure 8. Proportion (%) of production of major species from freshwater aquaculture of Southeast Asia in 2020 by quantity (left) and value (right)
Table 11. Production of major freshwater species from freshwater aquaculture of Southeast Asia in 2020 by quantity (MT) and value (US$ 1,000)
| Common name | Quantity (MT) |
Percentage in total freshwater culture production quantity (%) |
Value (US$ 1,000)* |
Percentage in total freshwater culture value (%) |
Value/Quantity (US$/MT)** |
| Striped catfish | 1,507,727 | 17.3 | 11,642 | 0.1 | 881 |
| Nile tilapia | 1,492,333 | 17.1 | 2,393,748 | 29.5 | 1,664 |
| Torpedo-shaped catfishes | 1,079,585 | 12.4 | 1,236,082 | 15.2 | 1,202 |
| Misc. fishes | 858,084 | 9.9 | 506,678 | 6.2 | 1,645 |
| Common carp | 840,525 | 9.7 | 1,193,387 | 14.7 | 1,742 |
| Roho labeo | 701,936 | 8.1 | 905,385 | 11.2 | 1,304 |
| Cyprinid nei | 515,465 | 5.9 | 4,295 | 0.1 | 376 |
| Tilapias nei | 457,258 | 5.3 | 260,792 | 3.2 | 1,775 |
| Pangas catfishes nei | 443,990 | 5.1 | 439,703 | 5.4 | 1,349 |
| Silver barb | 289,902 | 3.3 | 224,055 | 2.8 | 1,043 |
| Giant gourami | 149,216 | 1.7 | 350,626 | 4.3 | 2,350 |
| Catfishes, hybrid | 99,344 | 1.1 | 145,577 | 1.8 | 1,465 |
| Striped snakehead | 89,452 | 1.0 | 5,546 | 0.1 | 2,262 |
| Giant river prawn | 64,973 | 0.7 | 313,940 | 3.9 | 7,061 |
* Data not available from Cambodia, Lao PDR, and Viet Nam
** Computation of price excludes corresponding quantity production from Cambodia, Lao PDR, and Viet Nam
Fishing Gear Analysis
Purse seines was the highest-producing fishing gear which accounted for about 24 % of the total production of all types of fishing gear, followed by gillnets at about 22.2 %, trawls at 21.8 %, hooks and lines at 16 %, others at 3.7 %, lift nets at 3.5 %, seine nets at 3.2 %, traps at 2.8 %, push/falling net at 2.1 %, and scoop nets at 0.5 %.
However, the production trend of fishing gear used in marine capture fisheries could not be appropriately analyzed as several countries such as Cambodia, Myanmar, Philippines, and Viet Nam were not able to provide the necessary information.
For the production and species caught by type of gear in the respective countries, the highest production in Brunei Darussalam was from purse seines which accounted for about 58.0 % of the total production of all types of fishing gear, with skipjack tuna (Katsuwonus pelamis) and yellowfin tuna (Thunnus albacares) as the main catch. This was followed by trawls at 31.0 % catching false trevally (Lactarius lactarius), others at 5.4 % catching yellowtail scad (Atule mate), and seine nets at 1.7 % with Sergestidae shrimps nei as the main catch.
For Indonesia, hooks and lines had the highest production at about 28.3 % with catch composed of skipjack tuna (Katsuwonus pelamis) at about 27.6 %, yellowfin tuna (Thunnus albacares) at about 16.7 %, longtail tuna (Thunnus tonggol) about 7.1 %, and narrow-barred Spanish mackerel (Scomberomorus commerson) about 6.6 %. Gillnets ranked second contributing about 28.0 % to the production from all types of gears which caught about 9.1 % narrow-barred Spanish mackerel (Scomberomorus commerson), about 6.5 % longtail tuna (Thunnus tonggol), and about 6.0 % goldstripe sardinella (Sardinella gibbosa). Purse seine came third which contributed 20.8 % to the marine capture fishery production catching skipjack tuna (Katsuwonus pelamis) at about 22.1 %, Indian scad (Decapterus russelli) at about 10.5 %, yellowfin tuna (Thunnus albacares) at about 8.3 %, and kawakawa (Euthynnus affinis) at about 7.9 %.
For Malaysia, trawls had the highest production at about 44.8 % with trash fishes at about 34.2 %, lizard fishes nei (Saurida spp.) at about 6.8 %, paste shrimp nei (Acetes spp.) at about 6.0 %, common squids nei (Loligo spp.) at about 5.8 %, and threadfin breams nei (Nemipterus spp.) at about 4.2 %. Purse seines came second which contributed 25.2 % to the marine capture fishery production catching scads nei (Decapterus spp.) at about 20.1 %, longtail tuna (Thunnus tonggol) at about 10.3 %, Sardinellas nei (Sardinella spp.) at about 9.0 %, trash fishes at about 8.7 %, Indian mackerels nei (Rastrelliger spp.) at about 7.8%, and Indian mackerel (Rastrelliger kanagurta) at about 6.2 %. Gillnets ranked third contributing about 19.4 % to the marine capture fishery production including about 24.7 % Indian mackerels nei (Rastrelliger spp.), about 5.6 % tigertooth croaker (Otolithes ruber), about 5.0 % Indian mackerel (Rastrelliger kanagurta), about 4.5% sea catfishes nei (Arius spp.).
For Thailand, trawls contributed the highest production at about 44.6 % of the marine capture fishery production composed mainly trash fishes at about 52.4 %, marine fishes nei at about 7.6 %, common squids nei (Loligo spp.) at about 5.3 %, threadfin breams nei (Nemipterus spp.) at about 4.6 %, and lizard fishes (Saurida spp.) at about 3.2 %. Purse seines ranked second contributing 28.2 % to the marine capture fishery production catching trash fishes at about 15.0 %, Sardinellas nei (Sardinella spp.) at about 10.8 %, Stolephorus anchovies (Stolephorus spp.) at about 10.7 %, kawakawa (Euthynnus affinis) at about 9.2 %, scads nei (Decapterus spp.) at about 8.4 %, and Indian mackerel (Rastrelliger kanagurta) at about 7.8%. Gillnets came in third ranking which contributed about 10.1 % to the marine capture fishery production catching Portunus swimcrabs nei (Portunus spp.) at about 16.4 %, marine fishes nei at about 16.0 %, Sardinellas nei (Sardinella spp.) at about 11.1 %, and banana prawn (Penaeus merguiensis) at about 7.8 %.
In the case of Singapore, all marine capture fishery production came from trawls with catch composed of scads nei (Decapterus spp.) accounting for about 10.4 %, snappers nei (Lutjanus spp.) at about 8.2 %, barramundi (Lates calcarifer) at about 6.4 %, and blue swimming crab (Portunus pelagicus) at about 6.4 %.
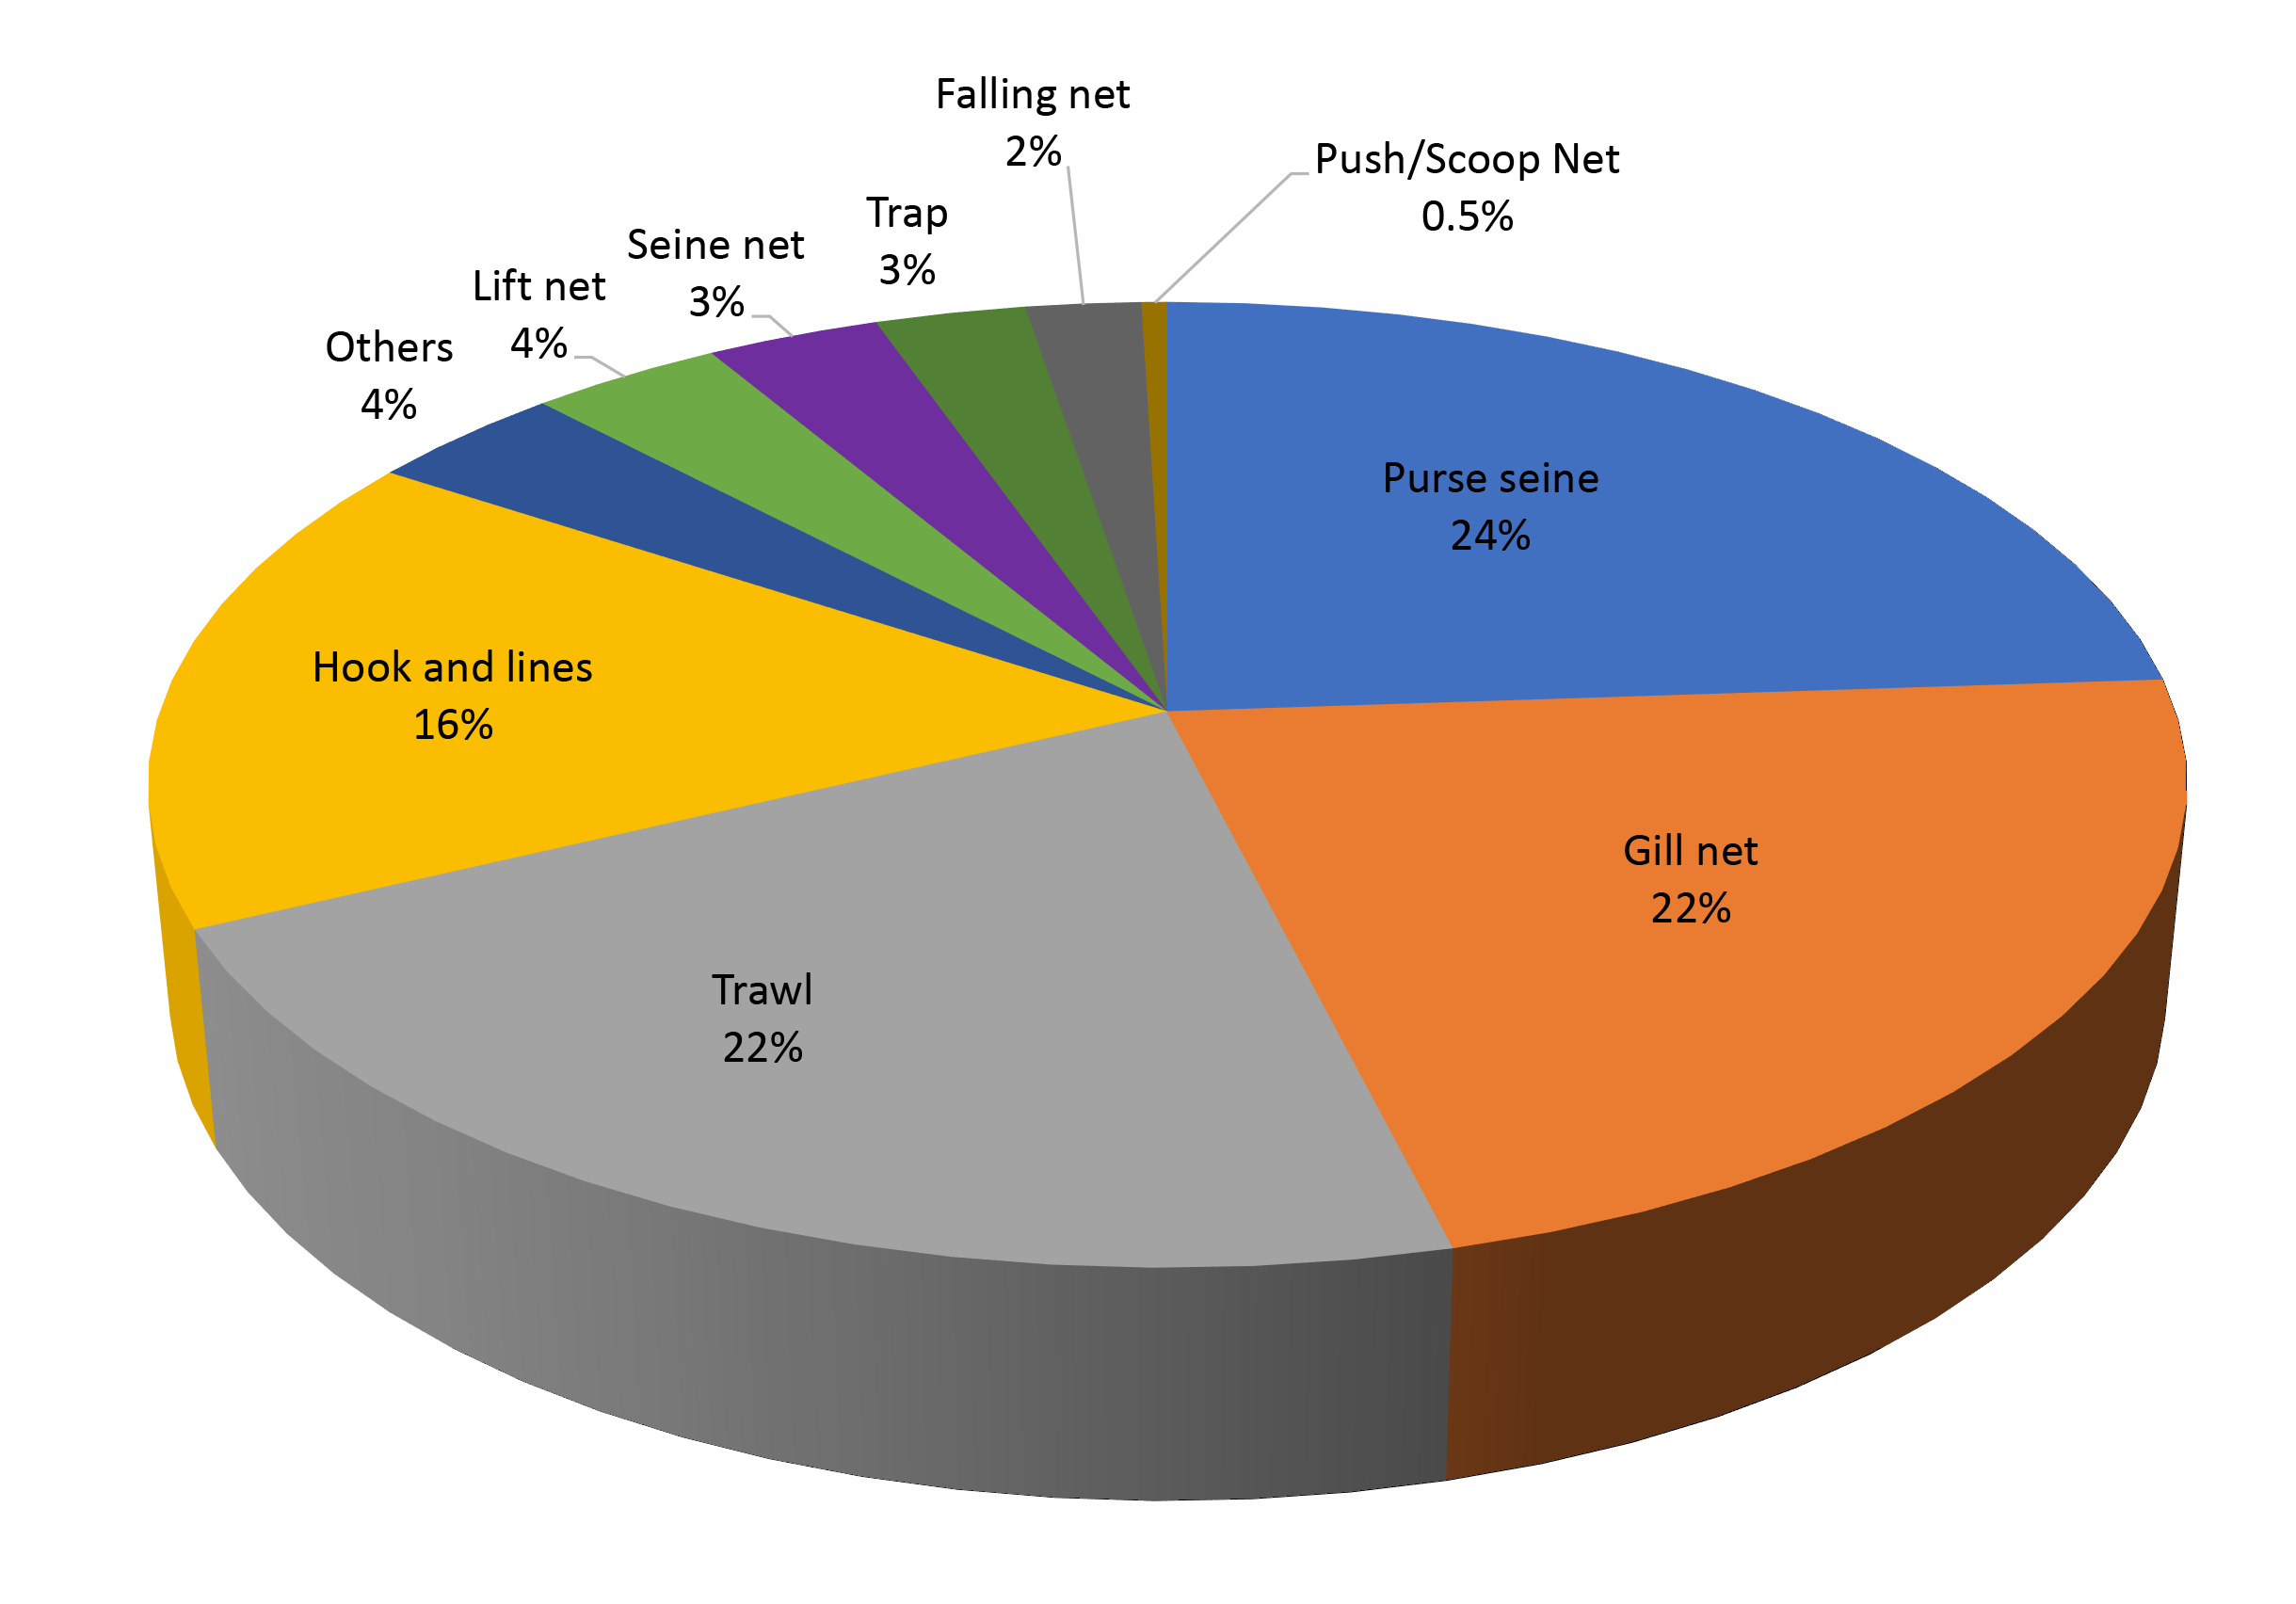
Figure 9. Proportion (%) of production by type of gear from marine capture fishery of Southeast Asia in 2020
Table 12. Production by type of gear from marine capture fishery of Southeast Asian countries in 2020 (MT)
| Fishing Gear | Brunei Darussalam | Indonesia | Malaysia | Singapore | Thailand |
| Purse Seines | 1,454.7 | 666,638 | 348,239 | … | 400,995 |
| Seine Nets | 41.63 | 161,183 | 27,481 | … | … |
| Trawls | 778.77 | 13,825 | 619,188 | 355.58 | 656,849 |
| Lift Nets | … | 141,611 | 18,486 | … | 49,843 |
| Falling Nets | … | … | … | … | 125,912 |
| Gill Nets | 0.073 | 898,192 | 268,177 | … | 148,667 |
| Traps | 26.26 | 118,481 | 23,597 | … | 22,130 |
| Hooks and Lines | 5 | 909,491 | 39,743 | … | 19,597 |
| Push/ Scoop Nets | … | 4,279 | 5,725 | … | 18,034 |
| Others | 136.67 | 154,565 | 32,662 | … | 30,075 |
Number of Fishing Boats by Type
Table 13. Number of fishing boats of Southeast Asian countries in 2020
| Country | Total | Non-powered Boat | Powered Boat |
| Brunei Darussalam | 1,332 | 139 | 1,193 |
| Cambodia | … | … | … |
| Indonesia | 1,161,332 | 159,417 | 1,001,915 |
| Lao PDR | … | … | … |
| Malaysia | 48,826 | 3,111 | 45,715 |
| Myanmar | 22,407 | 4,337 | 18,070 |
| Philippines | 5,557 | … | 5,557 |
| Singapore | 31 | … | 31 |
| Thailand | 10,388 | … | 10,388 |
| Viet Nam | 35,214 |
Number of Fishers by Working Status
Efforts should therefore be intensified to improve the availability of data and information by encouraging the countries to enhance their collection of data and information such as through the conduct of regular censuses and surveys. This would enable the countries to report the necessary data and information on fishing gear, fishery vessels, fishers and fish farmers, and especially small-scale fisheries operations.
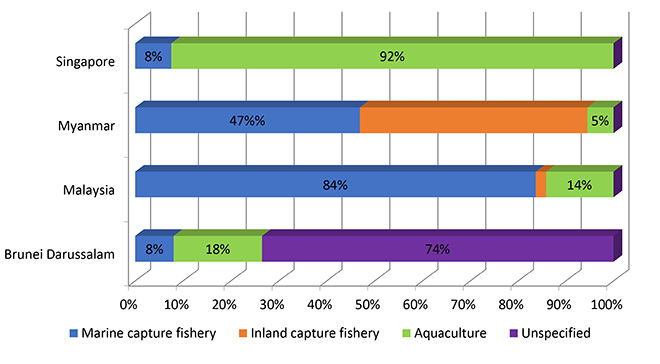
Figure 10. Percentage (%) of fishers and fish farmers engaged in the fisheries subsectors of the Southeast Asian countries in 2020
Table 14. Number of fishers by working status of Southeast Asian countries in 2020
| Country | Total | Marine Capture Fisheries |
Inland Capture Fisheries |
Aquaculture | Unspecified |
| Brunei Darussalam | 2,507 | 202 | … | 462 | 1,843 |
| Malaysia | 143,193 | 119,828 | 3,103 | 20,262 | … |
| Myanmar | 2,746,907 | 1,289,500 | 1,306,422 | 150,985 | … |
| Singapore | 555 | 42 | … | 513 | … |
Aquaculture Production of Ornamental Fishes
In terms of value, Indonesia reported the highest value (US$ 503,221 thousand) which was obtained from Asian arowana (Scleropages formosus) at US$ 38.2/pc, yellowface angelfish (Pomacanthus xanthometopon) at US$ 9.7/pc, silver arowana (Osteoglossum bicirrhosum) at US$ 6.8/pc, bluespotted wrasse (Anampses caeruleopunctatus) at US$ 6.8/pc, Jansens wrasse (Thalassoma jansenii) at US$ 6.8/pc, red discus (Symphysodon discus) at US$ 4.5/pc, and Chinese softshell turtle (Tryonix sinensis) at US$ 2.73/pc. Myanmar reported the second highest value (US$ 175 thousand ) which was obtained from tank goby (Glossogobius giuris) at US$ 13.3/pc followed by galaxy rasbora (Danio margaritatus) at US$ 2.2/pc, Botia historionica at US$ 1.21/pc, Garra flavatra at US$ 0.35/pc, Danio kyathit at US$ 0.28/pc, and Yunnanilius brevis at US$ 0.28/pc. Malaysia had the third highest value obtained from osteoglossids at US$ 23.62/pc, cichlids at US$ 3.77/pc, cyprinids at US$ 0.40/pc, anabantids at US$ 0.36/pc, callichthyids at US$ 0.24/pc, and characins at US$ 0.23/pc. Brunei Darussalam reported the fourth highest value obtained from arowana (Osteoglossidae) at US$ 59.7/pc, Palaemonetes pugio at US$ 7.5/pc, Cyprinus rubrofuscus at US$ 1.31/pc, goldfish (Carassius auratus) at US$ 0.75/pc, angelfish (Pterophyllum spp.) at US$ 0.75/pc, platy (Xiphophorus spp.) at US$ 0.75/pc., and cichlids at US$ 0.75/pc.
The aquaculture of ornamental fishes is a budding industry in the Southeast Asian region. Therefore, efforts should be made to improve the compilation and reporting of data to have a better picture of this industry.
Seed Production for Aquaculture
For the subsequent issues of this Bulletin, efforts would be exerted to gather the said information from other Southeast Asian countries, i.e. Lao PDR, Philippines, Thailand, and Viet Nam; and these countries would be encouraged to provide the necessary data. The real picture of this significant niche of the aquaculture industry could be established once all Southeast Asian countries provide the necessary data.
Analysis of Producer Price of Commodities From Capture Fisheries
Meanwhile, the producer price situation in 2020 for certain commercially important species including inland fish species, the producer price of common carp (Cyprinus carpio) was recorded at US$ 2.90/kg in Myanmar while it was US$ 1.60/kg in Thailand. For the Nile tilapia (Oreochromis niloticus), the producer price was US$ 2.24/kg in Malaysia and US$ 1.45/kg in Myanmar. For striped snakehead, (Channa striata), it was US$ 4.35/kg in Myanmar compared to US$ 1.65/kg in Indonesia. For torpedo-shaped catfishes nei (Clarias spp.), it was US$ 4.35/kg in Myanmar and US$ 1.30/kg in Malaysia. The producer price of marble goby (Oxyeleotris marmorata) was much higher at US$ 14.21 in Malaysia compared to US$ 2.31/kg in Indonesia. For other freshwater prawns (Palaemonidae), the producer price in Thailand was high at US$ 28.76/kg.
For marine fish species, the producer price of barramundi or giant sea perch, (Lates calcarifer) was US$ 7.88/kg in Singapore and US$ 2.59/kg in Indonesia. Redbelly yellowtail fusilier (Caesio cuning) was priced at US$ 6.14/kg in Brunei Darussalam and US$ 1.54/kg in Indonesia. Grouper nei (Epinephelus spp.) costed US$ 12.78/kg in Thailand and US$ 4.46/kg in Malaysia. Meanwhile, for threadfin breams nei (Nemipterus spp.), the producer price in Singapore was US$ 7.53/kg and US$ 1.94/kg in Brunei Darussalam. Threadfins and tasselfishes nei (Polynemidae) were US$ 16.31/kg in Singapore and US$ 4.41/kg in Thailand. Likewise, for silver pomfret (Pampus argenteus), the producer price in Thailand was relatively high at US$ 19.17/kg.
The producer price of yellowfin tuna (Thunnus albacares) was highest at US$ 3.21/kg in Malaysia while the lowest was at US$ 1.81/kg in Brunei Darussalam. Scads nei (Decapterus spp.) was priced at US$ 4.24/kg in Singapore and compared to US$ 1.0/kg in Brunei Darussalam. For yellowtail scad (Atule mate), the highest producer price was US$ 4.83/kg in Brunei Darussalam while the lowest price was US$ 1.55/kg in Indonesia.
For Indo-Pacific swamp crab (Scylla serrata), the highest producer price was reported by Singapore at US$ 12.72/kg while the lowest was US$ 3.69/kg in Indonesia. For blue swimming crab (Portunus pelagicus), the producer price in Thailand was at US$ 8.95/kg while the lowest was US$ 2.52/kg in Indonesia. For the giant tiger prawn (Penaeus monodon), the producer price in Brunei Darussalam was quite high at US$ 11.42/kg compared to US$ 3.76/kg in Indonesia; while flathead prawns (Thenus orientalis) in Thailand was also fairly high at US$ 7.99/kg. For common squids nei (Loligo spp.) was US$ 5.50/kg in Singapore compared to US$ 1.55/kg in Brunei Darussalam; while Natantia decapods nei was quite high at US$ 12.60/kg in Marine Capture Fisheries Singapore. Results of the analysis indicated that the producer prices of several commodities differed in each country, considering that prices were influenced by different factors such as supply and demand, cost of production including feeds and transportation, alternative commodities, and others. Furthermore, it could be observed that there generally wide ranges of producer prices of the same commodities among the countries in the region.