 SEAFDEC Southeast Asian Fisheries Development Center
OVERVIEW OF THE FISHERIES SECTOR OF SOUTHEAST ASIA IN 2021
Fish and fishery products are becoming increasingly important as primary sources of protein for many
people in the world, most especially for those in the Southeast Asian region. During the past decade,
the region’s production from capture fisheries and aquaculture has been considerably increasing.
Recently, many Southeast Asian countries are among the highest producers of fish and fishery products
in the world. For the year 2021, SEAFDEC compiled and analyzed the data and statistics provided by
the Southeast Asian countries to provide a glimpse of the increasing contribution of Southeast Asia’s
fishery and aquaculture production to the world’s food fish basket. Of the 11 countries that comprise
the Southeast Asian region, namely: Brunei Darussalam, Cambodia, Indonesia, Lao PDR, Malaysia,
Myanmar, Philippines, Singapore, Timor-Leste, Thailand, and Viet Nam, ten countries are covered in this publication as Timor-Leste has not yet been providing its fishery statistics and information to SEAFDEC.
Total Fishery Production of Southeast Asia
Table 1. Fishery production by continent from 2017 to 2021 (million MT)*
| 2017 | 2018 | 2019 | 2020 | 2021 | |
| World | 206.4 | 211.9 | 213.7 | 214.1 | 218.3 |
| Africa | 12.3 | 12.4 | 12.5 | 12.2 | 12.8 |
| America | 21.4 | 24.5 | 22.4 | 22.4 | 24.2 |
| Asia* | 107.5 | 108.5 | 112.9 | 114.1 | 116.5 |
| Southeast Asia** | 45.5 | 46.5 | 46.8 | 46.2 | 45.8 |
| Europe | 18.1 | 18.4 | 17.3 | 17.4 | 17.3 |
| Oceania | 1.6 | 1.6 | 1.8 | 1.8 | 1.7 |
* Source (except for Southeast Asia): FAO FishStat Plus-Universal Software for Fishery Statistical Time Series
** Source: Fishery Statistical Bulletin of Southeast Asia (SEAFDEC, 2024)
As shown in Table 2, the fishery production of Southeast Asia from 2017 to 2019 exhibited a fluctuated trend
especially in terms of volume (quantity) although report in terms of value was quite unstable. The fishery
production in terms of volume slightly decreased since 2020 with the average decrease of about 1.0 %, while
the average rate of increase of the value from 2020 to 2021 was about 53.7 % as Viet Nam started to report
the production value in 2021. However, since some countries i.e. Cambodia and Lao PDR were not able
to provide the value of their respective fishery production for 2021, such figures could be indicative only.
Nevertheless, the figures still imply that, most of the regional fishery commodities harvested were of high
value. By country, Indonesia reported the highest fishery production in 2021 in terms of volume accounting for about 47.6 % of the total fishery production of Southeast Asia, followed by Viet Nam contributing
about 18.4 %, and Myanmar at 13.3 %. The Philippines ranked fourth accounting for 9.2 %, Thailand at 5.3 %,
Malaysia at 3.8 %, and Cambodia at 1.9 %. The contributions of Lao PDR, Brunei Darussalam, and Singapore
to the fishery production of Southeast Asia in 2021 were minimal in terms of volume.
In terms of value, Indonesia accounted for about 36.3 % of the total value of the region’s fishery production
with Vite Nam emerging second contributing about 31.0 %, and Myanmar came in third contributing about
13.1 %. Meanwhile, the Philippines which ranked fourth in terms of volume and value contributed about
7.9 %, Thailand which ranked fifth in terms of production volume as well as value accounted for 6.9 %,
following Malaysia contributed about 4.6 %. Although the reported figures showed that the production
value in 2021 was significant increase, it should be noted that this is due to the fact that production value
of Viet Nam was included in 2021. The trend of the fishery production of the Southeast Asian countries in
2017–2021 is shown in Figure 1.
Table 2. Total fishery production of Southeast Asia by quantity and value (2017-2021)
| Total Fishery Production | 2017 | 2018 | 2019 | 2020 | 2021 |
| Quantity (MT) |
45,496,587 | 46,539,195 | 46,766,274 | 46,223,147 | 45,772,268 |
| Value (US$ 1,000) |
50,564,226* | 51,811,317* | 55,045,395* | 48,650,184* | 75,044,358** |
* Data not available from Cambodia, Lao PDR and Viet Nam
** Data not available from Cambodia and Lao PDR
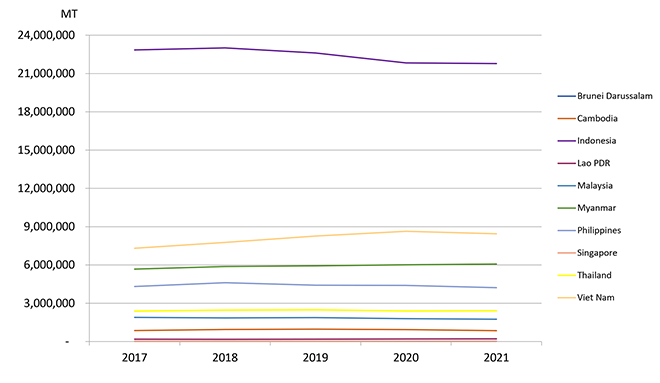
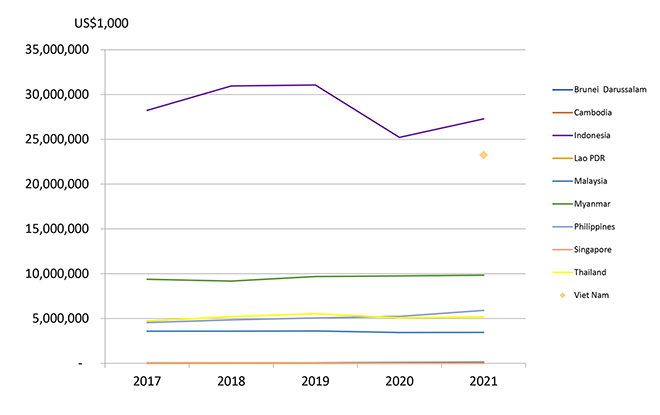
Figure 1. Fishery production of the Southeast Asian countries in 2017–2021 by quantity (MT) (left) and value (US$ 1,000) (right)
The fishery production of Southeast Asia is categorized into three subsectors, namely: marine capture fisheries, inland capture fisheries, and aquaculture. By subsector, the total fishery production of the region in 2021 as shown in Table 3 and Figure 2 indicated that the largest portion of the production volume was derived from aquaculture accounting for approximately 54.2 % followed by marine capture fisheries at about 39.2 %, and inland capture fisheries at 6.6 %. In terms of production value, aquaculture was reported at 47.2 %, marine capture fisheries accounted for 46.5 %, and inland capture fisheries at 6.3 %. While the value per MT of marine capture fishery production was about US$ 1,956/MT, those from inland capture fisheries and aquaculture were about US$ 1,842/MT and US$ 1,458/MT, respectively. This implies that while the value per MT of marine capture fisheries production was highest, the global market has started to recognize the value of aquatic products from inland capture fisheries, and has been patronizing such products lately.
Table 3. Production of fishery subsectors of Southeast Asia in 2021 by quantity (MT) and value (US$ 1,000)
| Sub-sector | Quantity (MT) |
Value* (US$ 1,000) |
Value/Quantity** (US$/MT) |
| Marine capture fisheries | 17,951,330 | 34,873,267 | 1,956 |
| Inland capture fisheries | 3,012,724 | 4,713,897 | 1,842 |
| Aquaculture | 24,808,215 | 35,457,194 | 1,458 |
| Total | 45,772,269 | 75,044,358 |
* Data not available from Cambodia and Lao PDR
** Computation of price excludes corresponding quantity production from Cambodia and Lao PDR
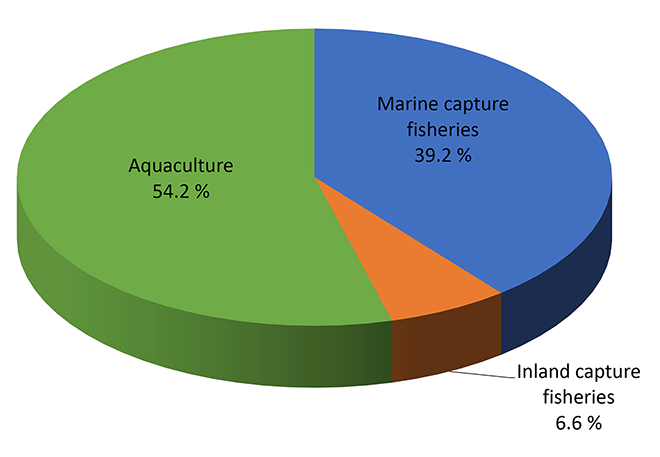
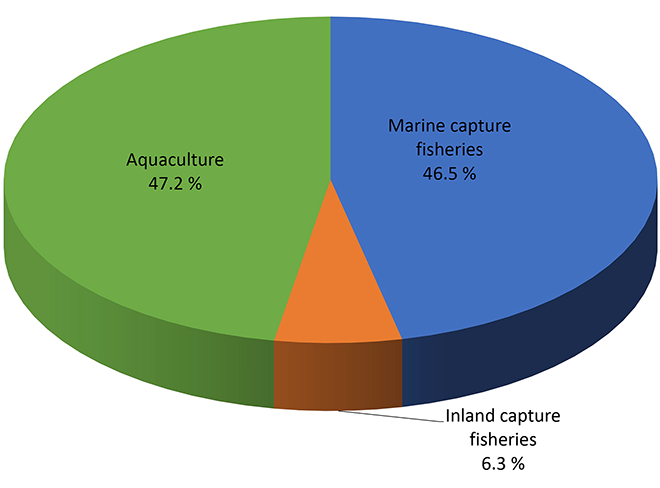
Figure 2. Proportion (%) of production of fishery subsectors of Southeast Asia in 2021 by quantity (left) and value (right))
Marine Capture Fishery Production of Southeast Asia
Table 4. Marine capture fishery production of Southeast Asia in 2017–2021 by quantity (MT) and value (US$ 1,000)
| Marine capture fishery production | 2017 | 2018 | 2019 | 2020 | 2021 |
| Quantity (MT) | 17,330,277 | 18,330,325 | 18,167,839 | 18,216,855 | 17,951,330 |
| Value (US$ 1,000) | 25,292,021* | 28,122,606* | 29,343,867* | 24,547,054* | 34,873,267** |
* Data not available from Cambodia and Viet Nam
** Data not available from Cambodia
In terms of volume, the total production from marine capture fisheries of the Southeast Asian countries during 2017–2021 indicated that Indonesia had the highest contribution to the region’s total production. Specifically, in 2021, the production of Indonesia was 6.7 million MT accounting for approximately 37.3 % of the region’s total, followed by Viet Nam with 3.4 million MT (18.9 %), Myanmar with 3.3 million MT (18.4 %), and Philippines with 1.8 million MT (10.0 %). Malaysia and Thailand also produced a considerable volume of aquatic commodities from marine capture fisheries with 1.3 million MT (7.4 %) and 1.3 million MT (7.2 %), respectively. The region’s production volume from marine capture fisheries in 2021 could be gleaned from Figure 3.
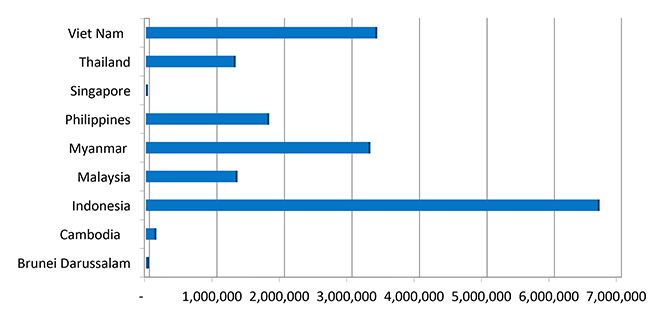
Figure 3. Marine capture fishery production of the Southeast Asian countries in 2021 by quantity (MT)
Although some Southeast Asian countries could not provide the data on the value of their production from marine capture fisheries, the trend of the total value of the region’s marine capture fishery production from 2017 to 2021 seemed to have fluctuation corresponding to the fluctuated trend of the region’s production volume. By country, Indonesia which led the Southeast Asian countries, accounted for about 35.6 % of the region’s marine capture fishery production value in 2021, with Viet Nam emerging second contributing about 27.2 %. Meanwhile, Myanmar which came in third in terms of value contributed about 15.6 %, Philippines came in fourth at 8.2 %, Malaysia at 7.5 %, and lastly, Thailand contributed about 5.7 %.
Aggregating the 2021 production volume from marine capture fisheries by major commodity groups (Table 5), marine fishes had the highest volume accounting for about 87.3 % followed by mollusks at 6.5 % while crustaceans, invertebrates, and seaweeds contributed 4.2 %, 0.4 %, and 0.3 %, respectively. It should be noted that 1.3 % was contributed by “other” commodity groups which could not be classified as some countries were not able to provide their respective production volumes by species. From 2020 to 2021, the production volume of crustaceans, seaweeds, and marine fishes decreased by about 12.9 %, 11.9 %, and 0.4 %, respectively, but the production volume of mollusks increased by about 16.6 %.
Table 5. Production of the major commodity groups from marine capture fisheries of Southeast Asia in 2017–2021 by quantity (MT)
| Commodity Group | 2017 | 2018 | 2019 | 2020 | 2021 |
| Marine fishes | 14,880,726 | 15,974,939 | 15,870,138 | 15,733,257 | 15,677,860 |
| Crustaceans | 718,355 | 765,095 | 859,449 | 862,655 | 751,066 |
| Mollusks | 830,724 | 564,974 | 940,461 | 996,996 | 1,163,014 |
| Seaweed | 47,271 | 44,383 | 67,848 | 64,414 | 56,734 |
| Invertebrates | 92,901 | 113,482 | 40,140 | 1,362 | 66,783 |
| Others | 760,300 | 867,452 | 389,803 | 559,533 | 235,873 |
| Total marine capture fishery production | 17,330,277 | 18,330,325 | 18,167,839 | 18,216,855 | 17,951,330 |
Comparing the volume of the total fishery production in 2021 with that of 2020, a decrease in the production of the marine capture fishery could be observed, which could have been influenced by several factors including decreased production of various major commodities of Viet Nam such as natantian decapods nei (Natantia) from Fishing Area 711 ; decreased production of major marine capture fishery of the Philippines, especially scads nei (Decapterus spp.), skipjack tuna (Katsuwonus pelamis), and yellowfin tuna (Thunnus albacares) from Fishing Area 71 ; and decreased production of Malaysia of various squids nei (Loliginidae, Ommastrephidae), Stolephorus anchovies nei (Stolephorus spp.) from Fishing Area 572 and 71.
1 Fishing area 57 covers the marine fishing areas of Myanmar, Thailand (Indian Ocean), Malaysia (West Coast of Peninsula Malaysia), and Indonesia (Malacca Striat, West Sumatra and South Java, Bali-Nusa Tenggara)
2 Fishing area 71 covers the marine fishing areas of Thailand (Gulf of Thailand), Cambodia, Viet Nam (Southwest and Southest), Malaysia (East Coast of Peninsula Malaysia, Sabah, Sarawak), Singapore, Brunei Darussalam, Philippines (Luzon, Visayas, Mindanao), and Indonesia (East Sumatra, North Java, Bali-Nusa Tenggara, Southwest Kalimantan, East Kalimantan, South Sulawesi, North Sulawesi, Maluku-Papua)
Moreover, the region’s production of major species such as Auxis thazard (frigate tuna) and Katsuwonus pelamis (skipjack tuna) decreased in 2021 when compared with 2020 which could have been influenced by the reduced production of Indonesia, Philippines, and Malaysia. The production of Scomberomorus guttatus (Indo-Pacific king mackerel) and Scomberomorus spp. (Seerfishes nei) also decreased in 2021 compared with 2020 which could have been influenced by decreased production of Malaysia. Meanwhile, the production of mollucs in 2021 increased compared with 2020, which could have been brought about by increased production of Indonesia, Thailand, and Viet Nam.
The commercially important marine species that provided a sizeable contribution to the total fishery production of Southeast Asia from marine capture fisheries by quantity and value in 2021 are shown in Table 6. The data indicate that miscellaneous marine fishes (unidentified) contributed the highest volume at about 56.3 % and value at about 50.9 %. Production from the tunas and tuna-like species group contributed about 14.5 % to the total production quantity and ranked second in terms of value accounting for about 12.5 % of the total production value, followed by the scads group contributed about 8.9 % to the total production quantity and value of about 7.1 % of the total production value, and molluks contributed about 6.5 % to the total production quantity and value about 13.2 % of the total production value.
The data in Table 6 also suggest that the production value per MT of Thunnus obesus (bigeye tuna) at US$ 6,191/MT was the highest among the commodities under crustaceans group at US$ 4,657/MT followed by molluscs group at US$ 3,992/MT, Scomberomorus spp. (seerfishes nei) at US$ 3,863/MT, Scomberomorus commerson (narrow-barred Spanish mackerel) at US$ 3,219/MT, Scomberomorus guttatus (Indo-Pacific king mackerel) at US$ 2,996/MT, other anchovies at US$ 2,592/MT, other scads at US$ 2,578/MT, Thunnus alalunga (albacore tuna) at US$ 2,620/MT, Caranx spp. (jacks, crevalles nei) at US$ 2,405/MT, Rastrelliger spp. (Indian mackerels nei) at US$ 2,209/MT, Thunnus albacares (yellowfin tuna) at US$ 2,109/MT, Thunnus maccoyii (Southern bluefin tuna) at US$ 2,104/MT, and Carangidae (carangids nei) at US$ 1,917/MT. The average value per MT of miscellaneous marine fishes (unidentified) which contributed the highest volume in 2021 was estimated at US$ 1,776/MT implying that this group could possibly have been composed of low-value fishes such as trash fishes.
Table 6. Production of commercially-important species from marine capture fishery of Southeast Asia in 2021 by quantity (MT) and value (US$)
| Group/Species | Quantity (MT) | Percentage in total quantity of marine capture production (%) |
Value (US$1,000)* |
Percentage in total value of marine capture production (%) |
Value/ Quantity (US$/MT)** |
| Tunas and Tuna-like species | 2,608,979 | 14.5 | 4,358,610 | 12.5 | 1,671 |
| Neritic tunas | 821,800 | 1,220,457 | 1,485 | ||
| Frigate tuna | 298,196 | 495,817 | 1,663 | ||
| Bullet tuna | 12,994 | 13,517 | 1,040 | ||
| Kawakawa | 241,627 | 345,750 | 1,431 | ||
| Longtail tuna | 268,983 | 365,373 | 1,358 | ||
| Oceanic tunas | 1,162,827 | 2,330,624 | 2,004 | ||
| Skipjack tuna | 699,155 | 1,026,594 | 1,468 | ||
| Albacore tuna | 12,190 | 31,938 | 2,620 | ||
| Southern bluefin tuna | 1,123 | 2,363 | 2,104 | ||
| Yellowfin tuna | 372,015 | 784,714 | 2,109 | ||
| Bigeye tuna | 78,344 | 485,015 | 6,191 | ||
| Tuna-like species | 624,352 | 807,529 | 1,293 | ||
| Narrow-barred Spanish mackerel | 210,033 | 676,052 | 3,219 | ||
| Indo-Pacific king mackerel | 26,089 | 78,169 | 2,996 | ||
| Seerfihes nei | 12,764 | 49,313 | 3,863 | ||
| Tune-like fishes nei | 375,466 | 3,995 | 11 | ||
| Scads | 1,588,155 | 8.9 | 2,485,312 | 7.1 | 1,565 |
| Bigeye scad | 208,322 | 378,816 | 1,818 | ||
| Yellowstripe scad | 147,790 | 219,799 | 1,487 | ||
| Torpedo scad | 95,242 | 118,992 | 1,249 | ||
| Indian scad | 44,085 | 35,546 | 806 | ||
| Scad nei | 714,601 | 865,666 | 1,211 | ||
| Jacks, crevalles nei | 170,259 | 409,408 | 2,405 | ||
| Carangids nei | 119,263 | 228,426 | 2,578 | ||
| Mackerels | 688,283 | 3.8 | 1,244,258 | 3.6 | 1,808 |
| Short mackerel | 159,558 | 298,737 | 1,872 | ||
| Indian mackerel | 211,759 | 373,959 | 1,766 | ||
| Indian mackerels nei | 31,855 | 70,373 | 2,209 | ||
| Island mackerels | 285,111 | 501,189 | 1,758 | ||
| Anchovies | 251,546 | 1.4 | 418,167 | 1.2 | 1,662 |
| Stolephorus anchovies | 119,658 | 76,374 | 638 | ||
| Other anchovies | 131,888 | 341,793 | 2,592 | ||
| Sardines | 799,399 | 4.5 | 580,904 | 1.7 | 727 |
| Spotted sardinella | 57,988 | 88,750 | 1,530 | ||
| Goldstripe sardinella | 167,356 | 129,457 | 774 | ||
| Bali sardinella | 404,125 | 233,228 | 577 | ||
| Rainbow sardines | 25,005 | 19,853 | 794 | ||
| Sardinellas nei | 144,925 | 109,598 | 756 | ||
| Crustaceans | 751,066 | 4.2 | 3,431,808 | 9.8 | 4,657 |
| Molluscs | 1,163,014 | 6.5 | 4,593,599 | 13.2 | 3,992 |
| Marine fishes unidentified | 10,100,888 | 56.3 | 17,760,609 | 50.9 | 1,776 |
* Data not available from Cambodia
** Computation of price excludes corresponding quantity production from Cambodia
Inland Capture Fishery Production of Southeast Asia
While the Southeast Asian countries reported their respective data on production quantity from inland capture fisheries during 2017–2021, only six countries reported the corresponding production values. Thus, the actual regional production trend of the inland capture fisheries subsector could not be established. At any rate, as the consistent top producer, Myanmar maintained a stable inland fishery production from 2017 to 2021. In 2021, the production from inland capture fisheries accounted for about 32.9 % of the country’s total production from capture fisheries, 26.5 % of the country’s total fishery production, and 3.5 % of the region’s total fishery production (Table 7). The second highest producer, Indonesia, reported a production volume of 479,607 MT in 2021 which represented 6.7 % of the country’s production from capture fisheries, 2.2 % of the country’s total fishery production, and 1.0 % of the region’s total fishery production. Meanwhile, Cambodia reported an inland capture fishery production volume of 383,050 MT in 2021 which represented 75.4 % of the country’s total production from capture fisheries, and 44.7 % of the country’s total fishery production, and 0.8 % of the region’s total fishery production.
It should be noted, however, that such production volumes could not be accurate considering that most of the countries still need to improve their systems of collecting and compiling their respective fishery statistics, especially concerning their production from inland capture fisheries.
Only four countries, namely: Indonesia, Malaysia, Philippines, and Thailand, provided production data from inland capture fisheries by species, while the other countries were not able to report due to the inadequacy of expertise in identifying and recording the catch by species. Capacity building in this aspect is, therefore, necessary to enable the countries to compile their respective inland fishery production by major groups of species. Thus, production from inland capture fisheries of Cambodia, Lao PDR, Myanmar, and Viet Nam in 2021 could not be analyzed in terms of species because these countries were not able to provide the breakdown of their production volume by species.
Table 7. Inland capture fishery production of the Southeast Asian countries in 2021 by quantity (MT)
| Country | Inland capture production (MT) | Total capture production (MT) | % of inland capture production to total capture production | Total fishery production (MT) | % of inland capture fishery production to total fishery production |
| Brunei Darussalam | … | 15,296 | … | 20,068 | … |
| Cambodia | 383,050 | 508,050 | 75.4 | 856,400 | 44.7 |
| Indonesia | 479,067 | 7,175,975 | 6.7 | 21,782,457 | 2.2 |
| Lao PDR | 71,000 | 71,000 | 100 | 206,008 | 34.5 |
| Malaysia | 5,562 | 1,333,603 | 0.4 | 1,750,790 | 0.3 |
| Myanmar | 1,612,400 | 4,907,470 | 32.9 | 6,074,820 | 26.5 |
| Philippines | 148,719 | 1,944,703 | 7.7 | 4,223,231 | 3.5 |
| Singapore | … | 306 | … | 5,549 | … |
| Thailand | 117,386 | 1,416,905 | 8.3 | 2,406,800 | 4.9 |
| Viet Nam | 195,000 | 3,590,746 | 5.4 | 8,446,146 | 2.3 |
| Total | 3,012,724 | 20,964,054 | Ave: 14.4 | 45,772,269 | Ave: 6.6 |
In overall, the group of freshwater fishes nei (Osteichthyes) with no species classification provided the highest production from inland capture fisheries accounting for 74.7 % of the region’s total inland capture fisheries production in 2021 (Table 8). As for the major species, production of striped snakehead (Channa striata) was the highest at 2.52 %, followed by Nile tilapia (Oreochromis niloticus) at 2.19 %, snakeskin gourami (Osphronemus goramy) at 1.4 %, torpedo-shaped catfishes nei (Clarias spp.) at 1.3 %, and silver barb (Barbonymus gonionotus) at 1.3 %. In terms of value, the group of freshwater fishes nei (Osteichthyes) provided the highest value production from inland capture fisheries accounting for 62.1 % of the region’s total inland capture fisheries production followed by striped snakehead (Channa striata) at 4.6 %, Nile tilapia (Oreochromis niloticus) at 2.6 %, torpedo-shaped catfishes nei (Clarias spp.) at 1.7 %, and Asian redtail catfish (Hemibagrus nemurus) at 1.6 %.
As for the production value per MT, Pangasius djambal was valued the highest among the commodities harvested through inland capture fisheries at US$ 2,932/MT, followed by the Asian redtail catfish (Hemibagrus nemurus) at US$ 2,895/MT, striped snakehead (Channa striata) at US$ 2,880/MT, climbing perch (Anabas testudineus) at US$ 2,395/MT, and torpedo-shaped catfishes nei (Clarias spp.) at US$ 2,046/MT.
Table 8. Production of major species from inland capture fisheries of Southeast Asia in 2021 by quantity (MT) and value (US$ 1,000)
| Common name | Quantity (MT) |
Percentage of total quantity of inland capture production (%) | Value (US$ 1,000)* | Percentage of total value of inland capture production (%) | Value/Quantity (US$/MT)** |
| Misc. fishes | 2,250,500 | 74.7 | 2,928,287 | 62.1 | 1,619 |
| Striped snakehead | 75,963 | 2.5 | 218,760 | 4.6 | 2,880 |
| Nile tilapia | 65,857 | 2.2 | 120,182 | 2.6 | 1,825 |
| Snakeskin gourami | 42,835 | 1.4 | 65,807 | 1.4 | 1,536 |
| Torpedo-shaped catfishes nei | 38,527 | 1.3 | 78,812 | 1.7 | 2,046 |
| Silver barb | 38,142 | 1.3 | 62,552 | 1.3 | 1,640 |
| Freshwater mollusks nei | 30,978 | 1.0 | 6,053 | 0.1 | 195 |
| Cyprinidae | 30,236 | 1.0 | 28,016 | 0.6 | 1,418 |
| Climbing perch | 29,932 | 1.0 | 71,690 | 1.5 | 2,395 |
| Asian redtail catfish | 26,071 | 0.9 | 75,474 | 1.6 | 2,895 |
| Pangasius djambal | 23,215 | 0.8 | 68,058 | 1.4 | 2,932 |
* Data not available from Cambodia and Lao PDR
** Computation of price excludes corresponding quantity production from Cambodia and Lao PDR
Aquaculture Production of Southeast Asia
The production of eucheuma seaweeds nei (Eucheuma spp.) of Indonesia as the largest producer of aquaculture products in 2021 contributed 48.3 % to the production volume and 11.5 % to the production value of the country’s aquaculture production. This was followed by gracilaria seaweeds nei (Gracilaria spp.) accounting for 8.4 %, Nile tilapia (Oreochromis niloticus) at 8.3 %, and torpedo-shaped catfishes (Clarias spp.) at 7.0 %. In the case of Viet Nam as the second-highest aquaculture producer, 30.7 % of its aquaculture production came from striped catfish (Pangasianodon hypophthalmus), followed by freshwater fishes nei (Osteichthyes) at 18.2 %, whiteleg shrimp (Penaeus vannamei) at 13.7 %, and cyprinids nei (Cyprinidae) at 9.8 % of the country’s aquaculture production.
For the Philippines as the third-highest aquaculture producer, the main aquaculture product was elkhorn sea moss (Kappaphycus alvarezii) contributing 57.1 % to the country’s aquaculture production, followed by milkfish (Chanos chanos) at 19.5 %, Nile tilapia (Oreochromis niloticus) at 7.7 %, Tilapia nei (Oreochromis (=Tilapia) spp.) at 4.7 %, and spiny eucheuma (Eucheuma denticulatum) at 2.0 %.
For Myanmar, the main production from aquaculture was roho labeo (Labeo rohita) which accounted for 58.8 % of the country’s aquaculture production, followed by silver barb (Barbonymus gonionotus) at 14.7 %, and common carp (Cyprinus carpio) at 10.2 %. Meanwhile, the main aquaculture product of Thailand was whiteleg shrimp (Penaeus vannamei) accounting for 37.5 % of the country’s aquaculture production , followed by Nile tilapia (Oreochromis niloticus) at 25.6 %, hybrid catfishes (C. gariepinus × C. macrocephalus) at 9.7 %, and green mussel (Perna viridis) at 5.3 %.
In terms of value of the region’s aquaculture production, the actual trend could not be established as some countries could not report their data regularly. For the available data in 2021, Brunei Darussalam attained the highest value at US$ 6,912/MT followed by Singapore at US$ 5,909/ MT, Thailand at US$ 2,989/MT, Viet Nam at US$ 2,731/MT, Malaysia at US$ 1,969/MT, Myanmar at US$ 1,628/MT, Philippines at US$ 1,188/MT, and Indonesia at US$ 941/MT. Meanwhile, the value of aquaculture production of Cambodia and Lao PDR in 2021 could not be calculated as their respective total production values were not reported.
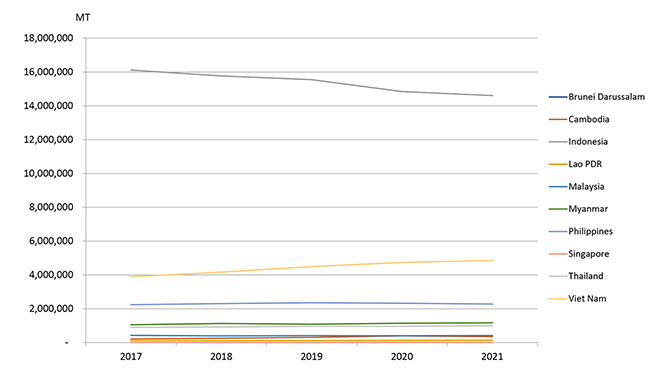
Figure 4. Trend of the aquaculture production (MT) of the Southeast Asian countries from 2017 to 2021
In terms of aquaculture production based on three culture environments, namely: mariculture, brackishwater culture, and freshwater culture, in 2021, the volume of mariculture contributed 41.2 % of the region’s total aquaculture production while brackishwater culture contributed 22.1 %, and the remaining 36.7 % came from freshwater culture. In terms of value, mariculture contributed 9.7 %, freshwater aquaculture production contributed 37.5 %, and brackishwater culture production contributed the highest at 52.8 % (Figure 5). Indonesia was the top producer of aquaculture products in the Southeast Asian region and had the highest production from mariculture, followed by Viet Nam from freshwater culture, Philippines from mariculture, Myanmar from freshwater culture, and Thailand from freshwater culture in 2021.
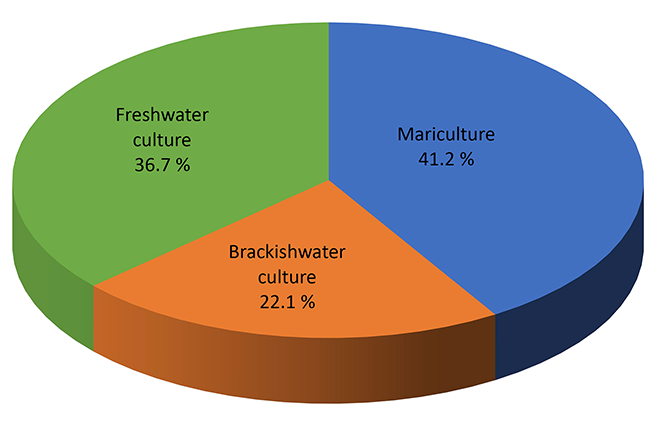
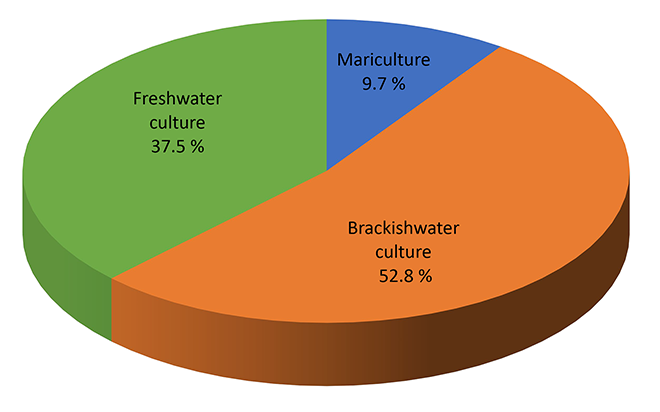
Figure 5 Proportion (%) of aquaculture production by culture environment of Southeast Asia in 2021 by quantity (left) and value (right))
From 2020 to 2021, the production volume from mariculture and brackishwater culture slightly decreased at 3.87 % and 2.21 %, respectively, which could be due to the decreased volume of production of Indo-Pacific swamp crab (Scylla serrata) of Viet Nam and groupers nei (Epinephelus spp.) of Indonesia and Malaysia. Meanwhile, the production value from freshwater culture slightly increased by 4.6 % which could be due to the increased production of common carp (Cyprinus carpio) of Indonesia, Thailand, and Viet Nam; and Nile tilapia (Oreochromis niloticus) of Indonesia.
Mariculture
In 2021, the region’s total production in terms of volume from mariculture contributed about 41.2 % to the region’s total aquaculture production and 9.7 % in terms of value. Farmed aquatic plants, such as eucheuma seaweeds (Eucheuma spp.), elkhorn sea moss (Kappaphycus alvarezii), Gracilaria lichenoides, warty gracilaria (Gracilaria verrucosa) and Japanese sargasso weed (Sargassum muticum), contributed 91.1 % to the region’s total mariculture production volume. The eucheuma seaweeds production of Indonesia accounted for about 69.1 % of the region’s total production volume from mariculture, followed by elkhorn sea moss as the main mariculture product of the Philippines which accounted for 14.4 %, and Gracilaria lichenoides which contributed about 5.5 %. The marine mollusks group contributed about 3.4 % to the region’s total mariculture production volume, with Viet Nam providing the highest production of marine mollusks nei. Milkfish (Chanos chanos) contributed about 1.7 % and warty gracilaria (Gracilaria verrucosa) contributed about 1.3 % of the region’s total production volume from mariculture. Meanwhile, green mussel (Perna viridis) contributed about 1.0 % with Thailand provided the highest production, followed by Japanese sargasso weed (Sargassum muticum) contributed about 0.8 % with Indonesia as the major producer, and blood cockle (Anadara granosa) contributed about 0.7 % with Thailand as the major producer (Figure 6).
In terms of value, Eucheuma spp. contributed 45.9 % to the region’s total mariculture production followed by milkfish (Chanos chanos) which contributed about 12.6 %, marine mollusks nei contributed about 10.5 %, Gracilaria lichenoides contributed about 7.5%, Kappaphycus alvarezii contributed about 6.2 %, and Anadara granosa contributed about 4.1 % (Figure 6).
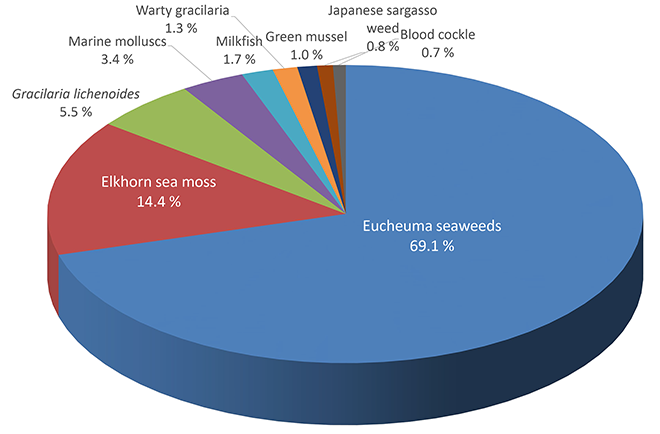
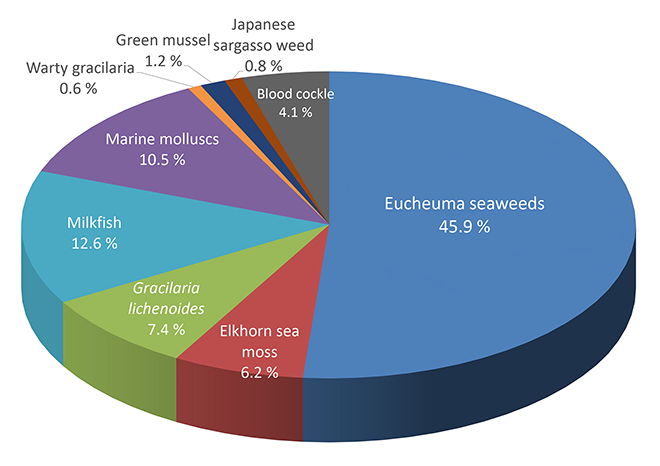
Figure 6. Proportion (%) of production of major species from mariculture of Southeast Asia in 2021 by quantity (left) and value (right)
Moreover, blood cockle commanded the highest value per volume at US$ 2,298/MT, followed by milkfish at US$ 2,100/MT, and marine mollusks nei at US$ 1,260/MT. Meanwhile, the lowest value was US$ 94/MT for spiny eucheuma (Table 9).
As for value per volume of mariculture production in 2021, Brunei Darussalam posted the highest at an average of US$ 8,211/MT from its production of Panulirus polyphagus, followed by Singapore at US$ 5,141/MT for mud spiny lobster barramundi (=giant seaperch) (Lates calcarifer) and Myanmar at US$ 3,400/MT for orange mud crab (Scylla olivacea). Meanwhile, the mariculture production value of Viet Nam was at US$ 1,313/MT, Thailand at US$ 1,309/MT, Philippines at US$ 423/MT, Indonesia at US$ 262/ MT, and Malaysia at US$ 146/MT.
Table 9. Production of major species from mariculture of Southeast Asia in 2021 by quantity (MT) and value (US$ 1,000)
| Common name | Quantity (MT) |
Percentage production in the total mariculture production (%) |
Value (US$ 1,000) | Percentage in total mariculture value (%) |
Value/Quantity (US$/MT)** |
| Eucheuma seaweeds nei | 7,059,254 | 69.1 | 1,557,715 | 45.9 | 221 |
| Elkhorn sea moss | 1,475,962 | 14.4 | 211,686 | 6.2 | 143 |
| Gracilaria lichenoides | 557,986 | 5.5 | 255,728 | 7.4 | 458 |
| Marine mollusks nei | 343,766 | 3.4 | 432,991 | 12.6 | 1,260 |
| Milkfish | 171,601 | 1.7 | 360,442 | 10.5 | 2,100 |
| Warty gracilaria | 134,016 | 1.3 | 22,170 | 0.6 | 165 |
| Green mussel | 106,261 | 1.1 | 40,064 | 1.5 | 353 |
| Japanese Sargasso seaweed | 85,317 | 0.8 | 28,778 | 0.8 | 337 |
| Blood cockle | 69,855 | 0.7 | 141,106 | 4.1 | 2,298 |
| Oysters | 62,381 | 0.6 | 38,418 | 1.1 | 616 |
| Spiny eucheuma | 46,123 | 0.5 | 4,316 | 0.1 | 94 |
* Data not available from Cambodia
** Computation of price excludes corresponding quantity production from Cambodia
Brackishwater Culture
The total production from brackishwater aquaculture in 2021 represented about 22.1 % of the region’s total aquaculture production and 52.8 % in terms of value. The major groups and species cultured in brackishwater include aquatic plants such as Gracilaria spp., crustaceans such as whiteleg shrimp (Penaeus vannamei), giant tiger shrimp (Penaeus monodon), and other shrimps, as well as fishes such as milkfish (Chanos chanos) and marine fishes, and others (Figure 7). Whiteleg shrimp (Penaeus vannamei) was mainly produced by Indonesia, Viet Nam, and Thailand, and had the highest volume contributing 34.2 % of the region’s total production from brackishwater aquaculture. The second highest was gracilaria seaweeds (Gracilaria spp.) at 22.5 % mainly produced by Indonesia, and the third highest was milkfish (Chanos chanos) at 19.2 % mainly produced by Indonesia and Philippines. Meanwhile, the group of fishes was 10.1 % followed by giant tiger prawn (Penaeus monodon) mainly from Viet Nam and Indonesia contributed 9.5 %, and other shrimps at 1.9 %. It should be noted that despite the COVID-19 pandemic, Brunei Darussalam had a significant increase in brackishwater culture production since 2020 due to the change in national policy that allowed the culture of whiteleg shrimps.
In terms of production value, whiteleg shrimp (P. vannamei) contributed the highest value of about 51.8 % which was produced by Indonesia, Viet Nam, and Thailand, followed by giant tiger shrimp (P. monodon) at 24.8 % from Viet Nam, Indonesia, Philippines, Myanmar, Malaysia, and Thailand, milkfish (Chanos chanos) at 8.9 % from Indonesia and Philippines, and miscellaneous fishes at 5.8 %. Although aquatic plants attained the second-highest production volume (22.5 %), the contribution in terms of value was only 0.6 % (Figure 7).
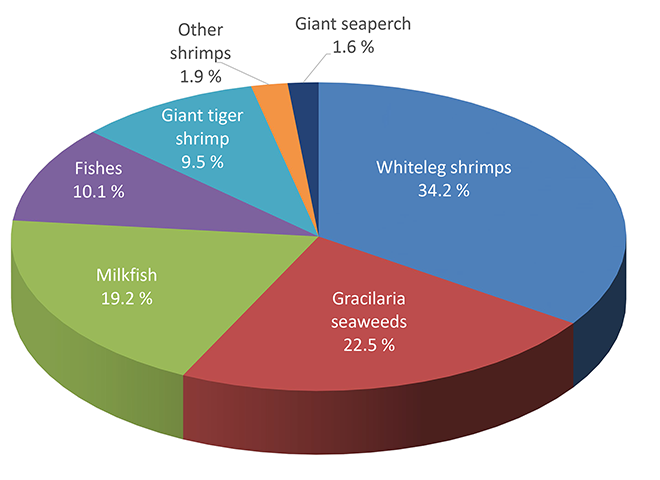
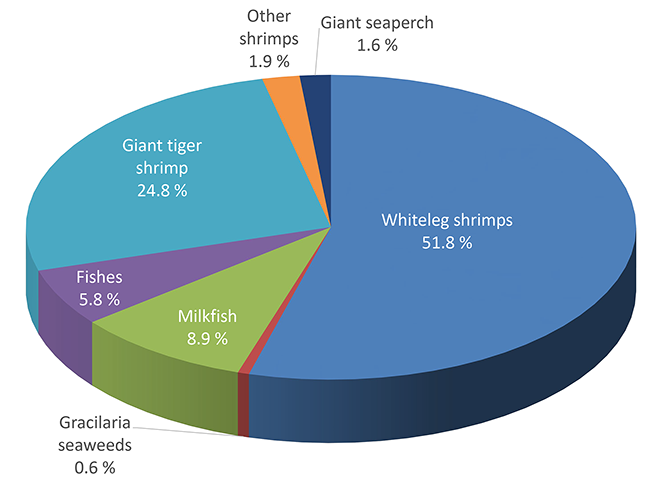
Figure 7. Proportion (%) of production of major species from brackishwater culture of Southeast Asia in 2021 by quantity (left) and value (right)
The highest value per MT was attained by the giant tiger shrimp (P. monodon) at US$ 8,871/MT followed by whiteleg shrimp (P. vannamei) at US$ 5,171/MT, giant seaperch at US$ 3,375/MT, other shrimps at US$ 3,375/MT, group of fishes at US$ 1,971/MT, milkfish (Chanos chanos) at US$ 1,584/MT, and Gracilaria spp. at US$ 87/MT (Table 10). Per country, Singapore posted the highest value per MT at US$ 13,651/MT followed by Brunei Darussalam at US$ 7,345/MT, Myanmar at US$ 7,276/MT, Viet Nam at US$ 5,792/MT, Malaysia at US$ 5,100/MT, Thailand at US$ 4,557/MT, Philippines at US$ 3,819/MT, and Indonesia at US$ 1,903/MT. However, Cambodia could not report the production value of brackishwater aquaculture.
Table 10. Production of major species from brackishwater culture in Southeast Asia in 2019 by quantity (MT) and value (US$)
| Common name | Quantity (MT) |
Percentage in total brackishwater culture production quantity(%) |
Value (US$ 1,000)* |
Percentage in total brackishwater culture value (%) |
Value/Quantity (US$/MT)** |
| Whiteleg shrimps | 1,875,724 | 34.2 | 9,698,725 | 51.8 | 5,171 |
| Gracilaria seaweeds | 1,236,943 | 22.5 | 107,383 | 0.6 | 87 |
| Milkfish | 1,055,344 | 19.2 | 1,672,039 | 8.9 | 1,584 |
| Misc. fishes | 553,682 | 10.1 | 1,088,675 | 5.8 | 1,971 |
| Giant tiger shrimp | 523,061 | 9.5 | 4,639,891 | 24.8 | 8,871 |
| Other shrimps | 104,178 | 1.9 | 353,890 | 1.9 | 3,443 |
| Giant seaperch | 88,000 | 1.6 | 294,106 | 1.6 | 3,375 |
* Data not available from Cambodia
** Computation of price excludes corresponding quantity production from Cambodia
Freshwater Culture
The region’s total production from freshwater culture in 2021 accounted for about 36.7 % of the region’s total aquaculture production volume, which was a slight increase of about 4.6 % from 2020. In 2021, Indonesia had the highest production from freshwater aquaculture at 3,648,973 MT or 40.1 % of the region’s total freshwater aquaculture production, followed by Viet Nam at 3,019,359 MT or 33.2 %, Myanmar at 1,110,968 MT or 12.2 %, Thailand at 450,730 MT or 4.9 %, Cambodia at 330,290 MT or 3.6 %, Philippines at 298,897 MT or 3.3 %, Lao PDR at 135,008 MT or 1.5 %, and Malaysia at 103,915 MT or 1.1 %.
Having accounted for 37.5 % of the region’s total aquaculture production value in 2021, freshwater aquaculture emerged to be crucial, notwithstanding the increase of its production value by 64.0 % in 2021 compared with that of 2020 since Viet Nam could report the production value in 2021. This information, however, should not be underestimated considering that the corresponding production values from Cambodia and Lao PDR had not yet been reported.
In terms of the production volume of the Southeast Asian countries by species (Figure 8), Nile tilapia (Oreochromis niloticus) accounted for 18.6 % of the region’s total production from freshwater aquaculture, which was contributed mainly by Indonesia. This was followed by striped catfish (Pangasianodon hypophthalmus) which accounted for 16.7 % and contributed mainly by Viet Nam, followed by torpedoshaped catfishes (Clarias spp.) at 12.2 % mainly from Indonesia, common carp (Cyprinus carpio) at 10.2 % mainly from Indonesia, roho labeo (Labeo rohita) at 7.7 % mainly from Myanmar, a group of freshwater fishes at 7.1 % mainly from Viet Nam, Cyprinids nei at 5.7 % mainly from Viet Nam, pangas catfishes nei (Pangasius spp.) accounted for 4.9 % mainly from Indonesia and Cambodia, tilapias nei (Oreochromis(=Tilapia) spp.) at 3.5 % mainly from Viet Nam and Philippines, silver barb (Barbonymus gonionotus) at 3.0 % mainly from Myanmar and Cambodia, giant gourami (Osphronemus goramy) at 1.6 % mainly from Indonesia, and Africabighead catfish, hybrid (Clarias gariepinus × C. macrocephalus) at 1.1 % mainly from Thailand.
On the production value, the highest contributor to the region’s total production value from freshwater aquaculture in 2021 was Nile tilapia (Oreochromis niloticus) which accounted for 22.8 % of the region’s total production from freshwater aquaculture, followed by striped catfish (Pangasianodon hypophthalmus) at 13.2 %, common carp (Cyprinus carpio) at 12.7 %, torpedo-shaped catfishes (Clarias spp.) at 10.4 %, Cyprinids nei at 6.8 %, roho labeo (Labeo rohita) at 6.7 %, a group of freshwater fishes at 6.1 %, pangas catfishes nei (Pangasius spp.) at 3.4 %, giant river prawn (Macrobrachium rosenbergii) at 3.1 %, giant gourami (Osphronemus goramy) at 2.9 %, silver barb (Barbonymus gonionotus) at 1.7 %, and tilapias nei (Oreochromis(=Tilapia) spp.) at 1.5 %.
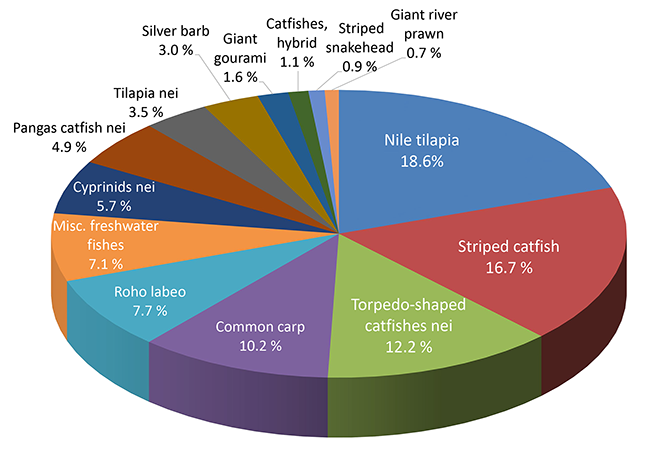
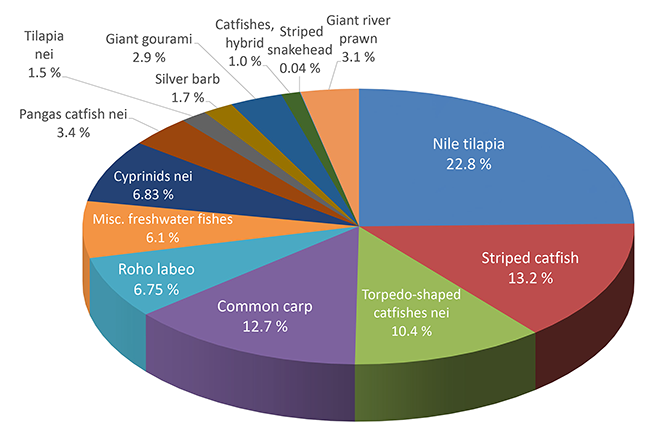
Figure 8. Proportion (%) of production of major species from freshwater aquaculture of Southeast Asia in 2021 by quantity (left) and value (right)
For the value per MT of major freshwater aquaculture species, the highest was earned by giant river prawn (Macrobrachium rosenbergii) at US$ 6,194/MT followed by giant gourami (Osphronemus goramy) at US$ 2,575/MT, striped snakehead (Channa striata) at US$ 2,310/MT, Cyprinids nei at US$ 1,900/MT, Nile tilapia (Oreochromis niloticus) at US$ 1,853/MT, common carp (Cyprinus carpio) at US$ 1,851/MT, a group of freshwater fishes at US$ 1,399/MT, pangas catfishes nei (Pangasius spp.) at US$ 1,305/MT, Africabighead catfish, hybrid (Clarias gariepinus × C. macrocephalus) at US$ 1,410/MT, roho labeo (Labeo rohita) at US$ 1,299/MT, torpedo-shaped catfishes (Clarias spp.) at US$ 1,255/MT, striped catfish (Pangasianodon hypophthalmus) at US$ 1,158/MT, silver barb (Barbonymus gonionotus) at US$ 1,031/MT, and tilapias nei (Oreochromis (= Tilapia) spp.) at US$ 607/MT (Table 11).
For the value per MT of major freshwater cultured species by country, Singapore presented the highest average value at US$ 6,924/MT. This was followed by Brunei Darussalam at US$ 5,972/MT, Malaysia at US$ 1,918/MT, Thailand at US$ 1,827/MT, Philippines at US$ 1,715/MT, Indonesia at US$ 1,622/MT, and Myanmar at US$ 1,346/MT.
Table 11. Production of major freshwater species from freshwater aquaculture of Southeast Asia in 2021 by quantity (MT) and value (US$ 1,000)
| Common name | Quantity (MT) |
Percentage in total freshwater culture production quantity (%) |
Value (US$ 1,000)* |
Percentage in total freshwater culture value (%) |
Value/Quantity (US$/MT)** |
| Nile tilapia | 1,688,515 | 18.6 | 3,032,265 | 22.8 | 1,853 |
| Striped catfish | 1,518,968 | 16.7 | 1,758,622 | 13.2 | 1,158 |
| Torpedo-shaped catfishes | 1,110,329 | 12.2 | 1,379,989 | 10.4 | 1,255 |
| Common carp | 924,607 | 10.2 | 1,688,962 | 12.7 | 1,851 |
| Roho labeo | 698,839 | 7.7 | 898,061 | 6.7 | 1,299 |
| Misc. fishes | 649,866 | 7.1 | 898,061 | 6.1 | 1,399 |
| Cyprinid nei | 514,433 | 5.7 | 908,171 | 6.8 | 1,900 |
| Pangas catfishes nei | 445,568 | 4.9 | 447,554 | 3.4 | 1,305 |
| Tilapias nei | 317,629 | 3.5 | 192,851 | 1.5 | 607 |
| Silver barb | 272,293 | 3.0 | 221,550 | 1.7 | 1,031 |
| Giant gourami | 147,982 | 1.6 | 380,996 | 2.9 | 2,575 |
| Catfishes, hybrid | 96,215 | 1.1 | 135,685 | 1.0 | 1,410 |
| Striped snakehead | 77,731 | 0.9 | 4,785 | 0.04 | 2,310 |
| Giant river prawn | 67,621 | 0.7 | 417,957 | 3.1 | 6,194 |
* Data not available from Cambodia and Lao PDR
** Computation of price excludes corresponding quantity production from Cambodia and Lao PDR
Fishing Gear Analysis
Gillnets were the highest-producing fishing gear accounting for about 29 % of the total production of all types of fishing gear, followed by hooks and lines at 20 %, purse seines at 17 %, trawls at 11 %, lift nets at 6 %, seine nets at 6 %, others at 5 %, traps at 4 %, falling net at 2 %, and push/scoop nets at 0.4 %.
However, the production trend of fishing gear used in marine capture fisheries could not be appropriately analyzed as several countries such as Cambodia, Myanmar, Philippines, and Viet Nam were not able to provide the necessary information.
For the production and species caught by type of gear in the respective countries, the highest production in Brunei Darussalam was from purse seines which accounted for about 70.9 % of the total production of all types of fishing gear, with skipjack tuna (Katsuwonus pelamis) and yellowfin tuna (Thunnus albacares) as the main catch. This was followed by trawls at 13.2 % catching false trevally (Lactarius lactarius), traps at 10.9 % catching spinefeet (= rabbitfishes) nei (Siganus spp.), and seine nets at 1.5 % with frigate and bullet tunas (Auxis thazard, A.rochei) as the main catch.
For Indonesia, gillnets had the highest production at about 30.7 % with catch composed of island mackerel (Rastrelliger faughni) at about 8.2 %, narrow-barred Spanish mackerel (Scomberomorus commerson) about 4.2 %, longtail tuna (Thunnus tonggol) about 3.8 %, and skipjack tuna (Katsuwonus pelamis) about 2.4 %. Hooks and lines ranked second catching skipjack tuna (Katsuwonus pelamis) at about 13.3 %, yellowfin tuna (Thunnus albacares) at about 13.2 %, longtail tuna at about 5.7 %, and narrow-barred Spanish mackerel (Scomberomorus commerson) about 4.6 %. Purse seines came third which contributed 20.8 % to the marine capture fishery production catching skipjack tuna at about 15.0 %, Japanese scad (Decapterus maruadsi) at about 14.6 %, yellowfin tuna (Thunnus albacares) at about 6.2 %, and Indian scad (Decapterus russelli) at about 6.0 %.
For Malaysia, trawls had the highest production at about 43.3 % with trash fishes at about 33.5 %, lizard fishes nei (Saurida spp.) at about 8.4 %, paste shrimp nei (Acetes spp.) at about 5.4 %, common squids nei (Loligo spp.) at about 5.1%, and threadfin breams nei (Nemipterus spp.) at about 4.1 %. Gillnets ranked second contributing about 22.7 % to the marine capture fishery production including about 23.0 % Indian mackerels nei (Rastrelliger spp.), about 5.6 % tigertooth croaker (Otolithes ruber), about 5.1 %, Indian mackerel (Rastrelliger kanagurta), about 4.2 % sea catfishes nei (Arius spp.). Hook and lines came third which contributed 3.6 % to the marine capture fishery production catching bigeye tuna (Thunnus obesus) at about 8.8 %, groupers nei (Epinephelus spp.) at about 5.8 %, narrow-barred Spanish mackerel (Scomberomorus commerson) at about 5.4 %, Malabar blood snapper (Lutjanus malabaricus) at about 5.0 %, and John’s snapper (Lutjanus johnii) at about 5.0 %.
For Thailand, purse seines contributed the highest production at about 36.9 % of the marine capture fishery production composed mainly of Stolephorus anchovies (Stolephorus spp.) at about 16.0 %, scads nei (Decapterus spp.) at about 14.0 %, Indian mackerel (Rastrelliger kanagurta) at about 10.7 %, and Sardinellas nei (Sardinella spp.) at about 9.9 %. Trawls ranked second contributing 25.9 % to the marine capture fishery production catching common squids nei (Loligo spp.) at about 17.1 %, threadfin breams nei (Nemipterus spp.) at about 11.5 %, lizard fishes nei (Saurida spp.) at about 8.0 %, and Stolephorus anchovies (Stolephorus spp.) at about 6.7 %. Gillnets came in third ranking which contributed about 17.8 % to the marine capture fishery production catching portunus swim crabs nei (Portunus spp.) at about 19.6 %, Indian mackerel (Rastrelliger kanagurta) at about 14.5 %, Indian mackerels nei (Rastrelliger spp.) at about 9.9 %, and Sardinellas nei at about 9.8 %.
In the case of Singapore, all marine capture fishery production came from trawls with catch composed of snappers nei (Lutjanus spp.) accounting for about 12.4 %, silver ponfrets nei (Pampus spp.) at about 9.7 %, narrow-barred Spanish mackerel (Scomberomorus commerson) at about 6.2 %, threadfins nei (Polynemus spp.) at about 5.3 %, and barramundi (Lates calcarifer) at about 5.0 %.
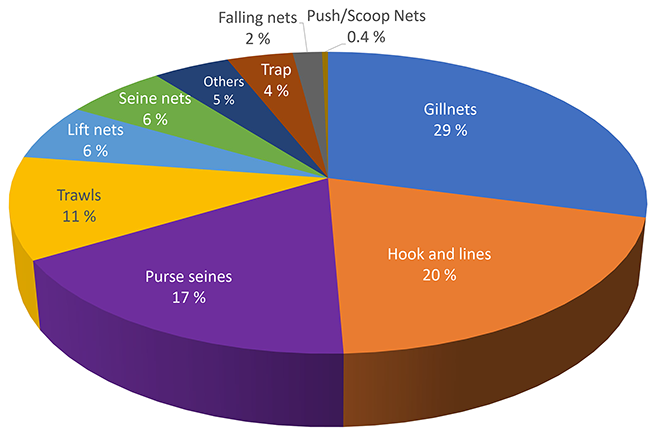
Figure 9. Proportion (%) of production by type of gear from marine capture fishery of Southeast Asia in 2021
Table 12. Production by type of gear from marine capture fishery of Southeast Asian countries in 2021 (MT)
| Fishing Gear | Brunei Darussalam | Indonesia | Malaysia | Singapore | Thailand |
| Purse Seines | 1,632 | 1,058,378 | 27,929 | … | 294,967 |
| Seine Nets | 34 | 465,778 | 20,795 | … | … |
| Trawls | 304 | 105,781 | 574,835 | 310 | 206,583 |
| Lift Nets | … | 474,722 | 16,324 | … | 2,693 |
| Falling Nets | … | 36,347 | … | … | 104,532 |
| Gill Nets | 15 | 1,918,512 | 301,991 | … | 142,606 |
| Traps | 251 | 296,835 | 2,441 | … | 17,835 |
| Hooks and Lines | 33 | 1,571,791 | 48,339 | … | 15,990 |
| Push/ Scoop Nets | … | 21,264 | 7,313 | … | 0.03 |
| Others | … | 295,465 | 60,646 | … | 13,522 |
Number of Fishing Boats by Type
Table 13. Number of fishing boats of Southeast Asian countries in 2021
| Country | Total | Non-powered Boat | Powered Boat |
| Brunei Darussalam | 1,764 | 264 | 1,500 |
| Cambodia | 7,613 | 340 | 7,273 |
| Indonesia | 924,894 | 133,474 | 791,420 |
| Lao PDR | … | … | … |
| Malaysia | 48,493 | 3,089 | 45,404 |
| Myanmar | 17,622 | 3,216 | 14,406 |
| Philippines | 5,091 | … | 5,091 |
| Singapore | 22 | … | 22 |
| Thailand | 10,107 | … | 10,107 |
| Viet Nam | 35,099 | … | … |
Number of Fishers by Working Status
Efforts should therefore be intensified to improve the availability of data and information by encouraging the countries to enhance their collection of data and information through the conduct of regular censuses and surveys. This would enable the countries to report the necessary data and information on fishing gear, fishery vessels, fishers and fish farmers, and especially small-scale fisheries operations.
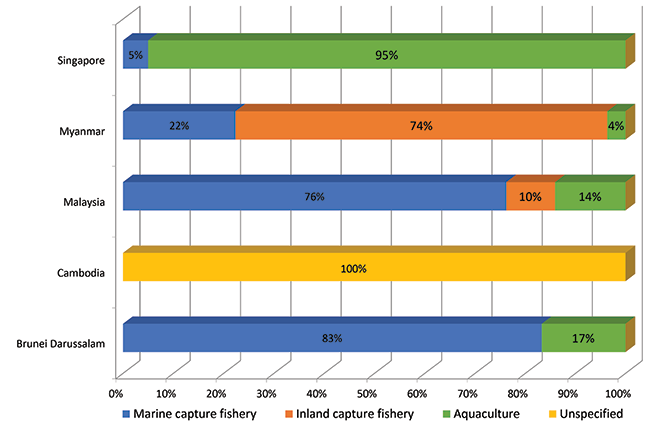
Figure 10. Percentage (%) of fishers and fish farmers engaged in the fisheries subsectors of the Southeast Asian countries in 2021
Table 14. Number of fishers by working status of Southeast Asian countries in 2021
| Country | Total | Marine Capture Fisheries |
Inland Capture Fisheries |
Aquaculture | Unspecified |
| Brunei Darussalam | 2,658 | 2,213 | … | 445 | … |
| Cambodia | 1,203,395 | … | … | … | 1,203,395 |
| Malaysia | 150,821 | 114,979 | 14,601 | 21,241 | … |
| Myanmar | 1,598,968 | 371,500 | 430,968 | 796,500 | … |
| Singapore | 763 | 38 | … | 725 | … |
Aquaculture Production of Ornamental Fishes
In terms of value, Indonesia reported the highest value (US$ 534 million) from Jansens wrasse (Thalassoma jansenii) at US$ 7.0/pc, bluespotted wrasse (Anampses caeruleopunctatus) at US$ 6.9/pc, Asian arowana (Scleropages formosus) at US$ 5.4/pc, red discus (Symphysodon discus) at US$ 5.1/pc, and silver arowana (Osteoglossum bicirrhosum) at US$ 4.9/pc. Malaysia had the second highest value (US$ 124 million) obtained from osteoglossids at US$ 29.1/pc, cyprinids at US$ 0.4/pc, anabantids at US$ 0.9/pc, callichthyids at US$ 0.2/pc, and characins at US$ 0.2/pc. Brunei Darussalam reported the fourth highest value (US$ 12 million) obtained from arowana (Osteoglossidae) at US$ 223.5/pc, Cyprinus rubrofuscus at US$ 7.0/pc, goldfish (Carassius auratus) at US$ 3.7/pc, Amphilophus citrinellus × Vieja melanurus at US$ 2.2/pc, platy (Xiphophorus spp.) at US$ 0.4/pc, guppy (Poecilia reticulata) at US$ 0.4/pc., and molly (Poecilia spp.) at US$ 0.4/pc. Myanmar reported the third highest value (US$ 188,000) which was obtained from Garra flavatra at US$ 0.3/pc, galaxy rasbora (Danio margaritatus) at US$ 0.1/pc, Botia historionica at US$ 0.1/pc, Danio kyathit at US$ 0.1/pc, and Yunnanilius brevis at US$ 0.1/pc.
The aquaculture of ornamental fishes is a budding industry in the Southeast Asian region. Therefore, efforts should be made to improve the compilation and reporting of data to have a better picture of this industry.
Seed Production for Aquaculture
In 2021, only six countries, namely Brunei Darussalam, Indonesia, Malaysia, Myanmar, Singapore, and Viet Nam reported the seed production. the main seeds produced by Brunei Darusslam were whiteleg shrimp (Penaeus vannmei), followed by blue shrimp (Penaeus stylirostris) and barramundi (Lates calcarifer). For Indonesia, the main seeds produced were whiteleg shrimp (Penaeus vannmei) followed by Philippine catfish (Clarias batrachus) and Nile tilapia (Oreochromis niloticus). For Malaysia, the main seeds produced were whiteleg shrimp (Penaeus vannmei), followed by giant tiger shrimp (Penaeus monodon) and torpedoshaped catfishes nei (Clarias spp.). For Myanmar, the main seeds produced were roho labeo (Labeo rohita) while the main seeds produced by Singapore were whiteleg shrimp (Penaeus vannmei). The main seeds produced by Viet Nam were whiteleg shrimp (Penaeus vannmei) followed by giant tiger shrimp (Penaeus monodon).
For the subsequent issues of the Bulletin, efforts would be exerted to gather the said information and encourage other Southeast Asian countries, i.e. Lao PDR, Philippines, and Thailand to provide the data. The real picture of this significant niche of the aquaculture industry could be established when all Southeast Asian countries provide the necessary data.
Analysis of Producer Price of Commodities From Capture Fisheries
In 2021, the producer price range (highest and lowest) of certain commercially important species including inland fish species could be observed from the figures provided. For common carp (Cyprinus carpio), the highest producer price was US$ 2.6/kg in Indonesia while the lowest price was US$ 1.6/kg in Thailand. For Nile tilapia (Oreochromis niloticus), the producer price was US$ 2.45/kg in Malaysia and US$ 0.9/kg in Myanmar. For striped snakehead, (Channa striata), it was US$ 3.2/kg in Thailand compared to US$ 2.9/kg in Indonesia. For torpedo-shaped catfishes nei (Clarias spp.), it was US$ 2.3/kg in Thailand while it was US$ 1.6/kg in Malaysia. For river eel nei (Anguilla spp.) it was US$ 11.3/kg in Malaysia and US$ 3.7/kg in Thailand. The producer price of marble goby (Oxyeleotris marmorata) was much higher at US$ 14.2/kg in Malaysia compared to US$ 2.1/kg in Indonesia. For giant river prawn (Macrobrachium rosenbergii), the producer price in Brunei Darussalam was higher at US$ 11.0/kg compared to US$ 7.1/kg in Indonesia.
For marine fish species, the producer price range of barramundi (Lates calcarifer) was from US$ 7.4/kg in Singapore and US$ 2.4/kg in Indonesia. Grouper nei (Epinephelus spp.) cost US$ 8.1/kg in Singapore and US$2.0/kg in Indonesia. For threadfin breams nei (Nemipterus spp.), the producer price in Singapore was US$ 7.4/kg and US$ 1.3/kg in Thailand. The cost of snappers nei (Lutjanus spp.) was US$ 6.5/kg in Singapore while it was US$2.0 /kg in Indonesia. Threadfins and tasselfishes nei (Polynemidae) were high at US$ 15.5/kg in Singapore.
The producer price of yellowfin tuna (Thunnus albacares) was highest at US$3.01/kg in Malaysia while the lowest was at US$ 1.5/kg in Indonesia. Scads nei (Decapterus spp.) was priced at US$ 3.7/kg in Singapore and compared to US$ 0.9 /kg in Brunei Darussalam. For yellowtail scad (Atule mate), the producer price was US$ 4.2 /kg in Brunei Darussalam while the price was US$ 1.5/kg in Indonesia.
For Indo-Pacific swamp crab (Scylla serrata), the highest producer price was reported by Singapore at US$ 12.1 /kg while the lowest was US$ 3.6 /kg in Brunei Darussalam. For blue swimming crab (Portunus pelagicus), the producer price in Thailand was at US$ 5.8/kg while the lowest was US$ 1.6/kg in Brunei Darussalam. For the giant tiger prawn (Penaeus monodon), the producer price in the Philippines was quite high at US$ 10.0/kg compared to US$ 4.7/kg in Indonesia; while the green tiger prawn (Penaeus semisulcatus) was US$ 10.1/kg in Brunei Darussalam and the lowest was at US$ 1.8/kg in Indonesia. The ornate spiny lobster (Panulirus ornatus) in Indonesia was high at US$ 39.2/kg. For common squids nei (Loligo spp.) was US$ 5.4/kg in Thailand compared to US$ 1.2/kg in Brunei Darussalam, while Natantia decapods nei was quite high at US$ 11.1 /kg in Singapore. Results of the analysis indicated that the producer prices of several commodities differed in each country, considering that prices were influenced by different factors such as supply and demand, cost of production including feeds and transportation, alternative commodities, and others. Nevertheless, it could be clearly observed that there were generally wide ranges of producer prices of the same commodities among the countries in the region.