 SEAFDEC Southeast Asian Fisheries Development Center
OVERVIEW OF THE FISHERIES SECTOR OF SOUTHEAST ASIA IN 2019
Fish and fishery products are becoming more increasingly important as primary sources of protein for many peoples in the world, most especially for those in the Southeast Asian region. During the past decade, the region’s production from capture fisheries and aquaculture had been considerably increasing, and recently, many Southeast Asian countries are among the highest producers of fish and fishery products in the world. This publication is therefore intended to provide the readers with a glimpse of the increasing contribution of Southeast Asia’s fishery and aquaculture production to the world’s food fish basket. Based on the data and statistics provided by the Southeast Asian countries for the year 2019, the SEAFDEC Secretariat compiled and analyzed the necessary information for this publication. Of the 11 countries that comprise the Southeast Asian region, namely: Brunei Darussalam, Cambodia, Indonesia, Lao PDR, Malaysia, Myanmar, Philippines, Singapore, Timor-Leste, Thailand, and Viet Nam, only ten countries are covered in this publication as Timor-Leste has not yet been providing its fishery statistics and information to the SEAFDEC Secretariat.
Total Fishery Production of Southeast Asia
Table 1. Fishery production by continent from 2015 to 2019 (million MT)*
| 2015 | 2016 | 2017 | 2018 | 2019 | |
| World | 196.6 | 198.9 | 206.4 | 211.9 | 213.7 |
| Africa | 10.9 | 11.5 | 12.3 | 12.4 | 12.5 |
| America | 21.3 | 20.0 | 21.4 | 24.5 | 22.4 |
| Asia** | 101.5 | 103.5 | 107.5 | 108.5 | 112.9 |
| Southeast Asia*** | 44.0 | 45.3 | 45.5 | 46.5 | 46.8 |
| Europe | 17.3 | 16.9 | 18.1 | 18.4 | 17.3 |
| Oceania | 1.6 | 1.7 | 1.6 | 1.6 | 1.8 |
* Source (except for Southeast Asia): FAO FishStat Plus-Universal Software for Fishery Statistical Time Series
** Excludes Southeast Asia
*** Source: Fishery Statistical Bulletin of Southeast Asia (SEAFDEC, 2022)
As shown in Table 2, the fishery production of Southeast Asia from 2015 to 2019 exhibited a continuously increasing trend especially in terms of volume (quantity) although the increases in terms of value were quite unstable. The annual average increase in volume from 2015 to 2019 was 1.5 %, while the annual average rate of increase of the value was about 9.5 %. However, since some countries were not able to provide the value of their respective fishery production for 2019, such figures could be indicative only. Nevertheless, the figures still imply that in addition to the increasing volume, most of the fishery commodities harvested in the region were of high value. By country, Indonesia reported the highest fishery production in 2019 in terms of volume accounting for about 48.4 % of the total fishery production of Southeast Asia, followed by Viet Nam contributing about 17.7 % and Myanmar at 12.7 %. The Philippines ranked next accounting for 9.4 %, Thailand at 5.3 %, Malaysia at 4.0 %, and Cambodia at 2.1 %. The contributions of Lao PDR, Brunei Darussalam, and Singapore to the fishery production of Southeast Asia in 2019 were minimal in terms of volume.
In terms of value, Indonesia accounted for about 56.4 % of the total value of the region’s fishery production with Myanmar emerging second contributing about 17.6 %, and Thailand came in third contributing about 10.0 %. Meanwhile, the Philippines which ranked fourth in terms of volume and value contributed about 9.2 %, and Malaysia which ranked fifth in terms of production volume as well as value accounted for 6.6 %. The trend of the fishery production of the Southeast Asian countries in 2015-2019 is shown in Figure 1.
Table 2. Total fishery production of Southeast Asia by quantity and value (2015-2019)
| Fishery Production |
2015 | 2016 | 2017 | 2018 | 2019 |
| Quantity (MT) |
43,998,054 | 45,336,010 | 45,496,587 | 46,539,195 | 46,766,274 |
| Value (US$ 1,000) |
38,746,241** | 41,155,302* | 50,564,226* | 51,811,317* | 55,045,395* |
* Data not available from Cambodia and Viet Nam
** Data not available from Cambodia, Lao PDR and Viet Nam
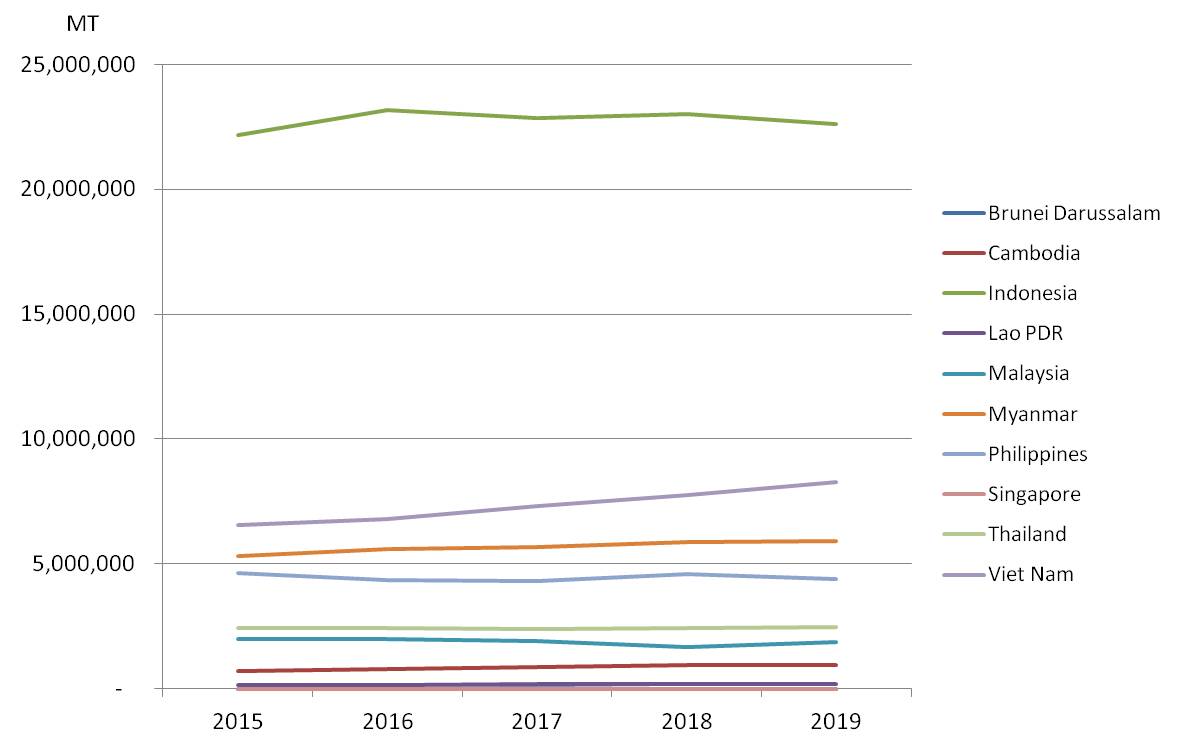
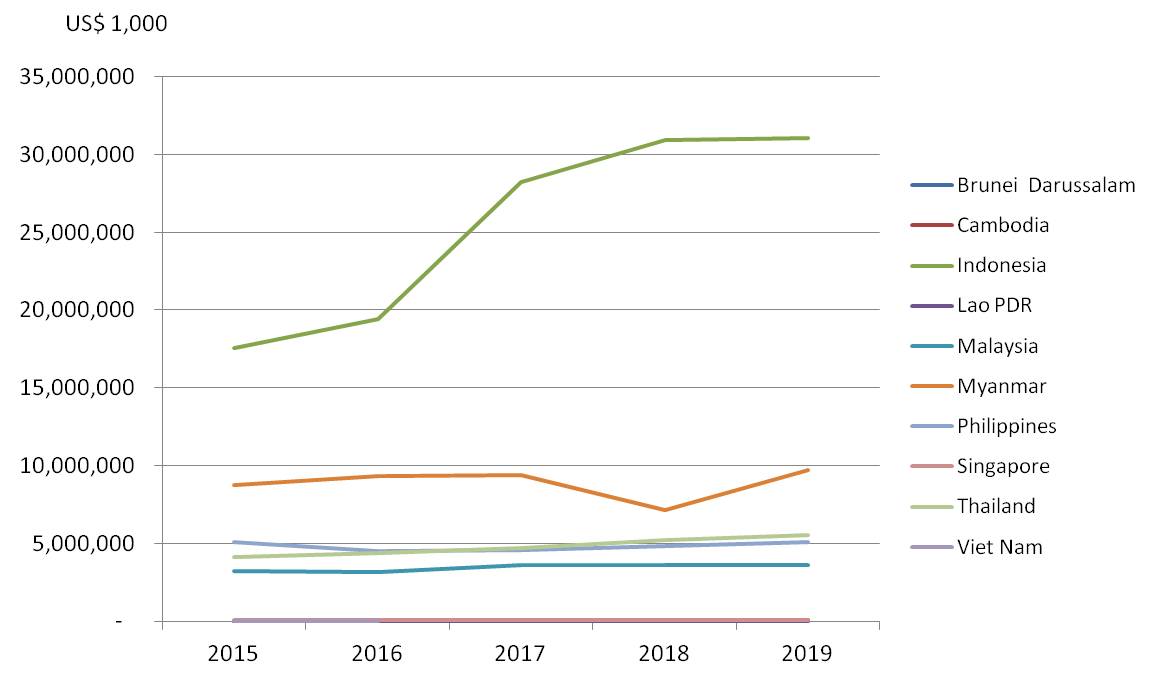
Fig. 1 Fishery production of the Southeast Asian countries in 2015-2019 (left in quantity; right in value)
The fishery production of Southeast Asia comes from three sub-sectors, namely: marine capture fisheries, inland capture fisheries, and aquaculture. By subsector, the total fishery production of the region in 2019 as shown in Table 3 indicated that the largest portion of the production volume was derived from aquaculture accounting for approximately 54 % followed by marine capture fisheries at about 39 % and
inland capture fisheries at 7 %. In terms of production value, marine capture fisheries accounted for 53 %, aquaculture at 39 %, and inland capture fisheries at 8 % (Figure 2). While the value per metric ton of marine capture fishery products was about US$ 2,031/MT, those from inland capture fisheries and aquaculture were about US$ 1,605/MT and US$ 1,063/MT, respectively. This implies that the global market had started to recognize the value of aquatic products harvested through inland capture fisheries, and had been patronizing such products lately.
Table 3. Fishery production (quantity and value) of Southeast Asia in 2019
| Sub-sector | Quantity (MT) |
Value* (US$ 1,000) |
Value/Quantity** (US$/MT) |
| Marine capture fisheries | 18,167,839 | 29,343,867 | 2,031 |
| Inland capture fisheries | 3,316,808 | 4,056,224 | 1,605 |
| Aquaculture | 25,281,627 | 21,645,304 | 1,063 |
| Total | 46,766,274 | 55,045,395 |
* Data not available from Cambodia, Lao PDR and Viet Nam
** Computation of price excludes corresponding quantity production from Cambodia, Lao PDR, and Viet Nam
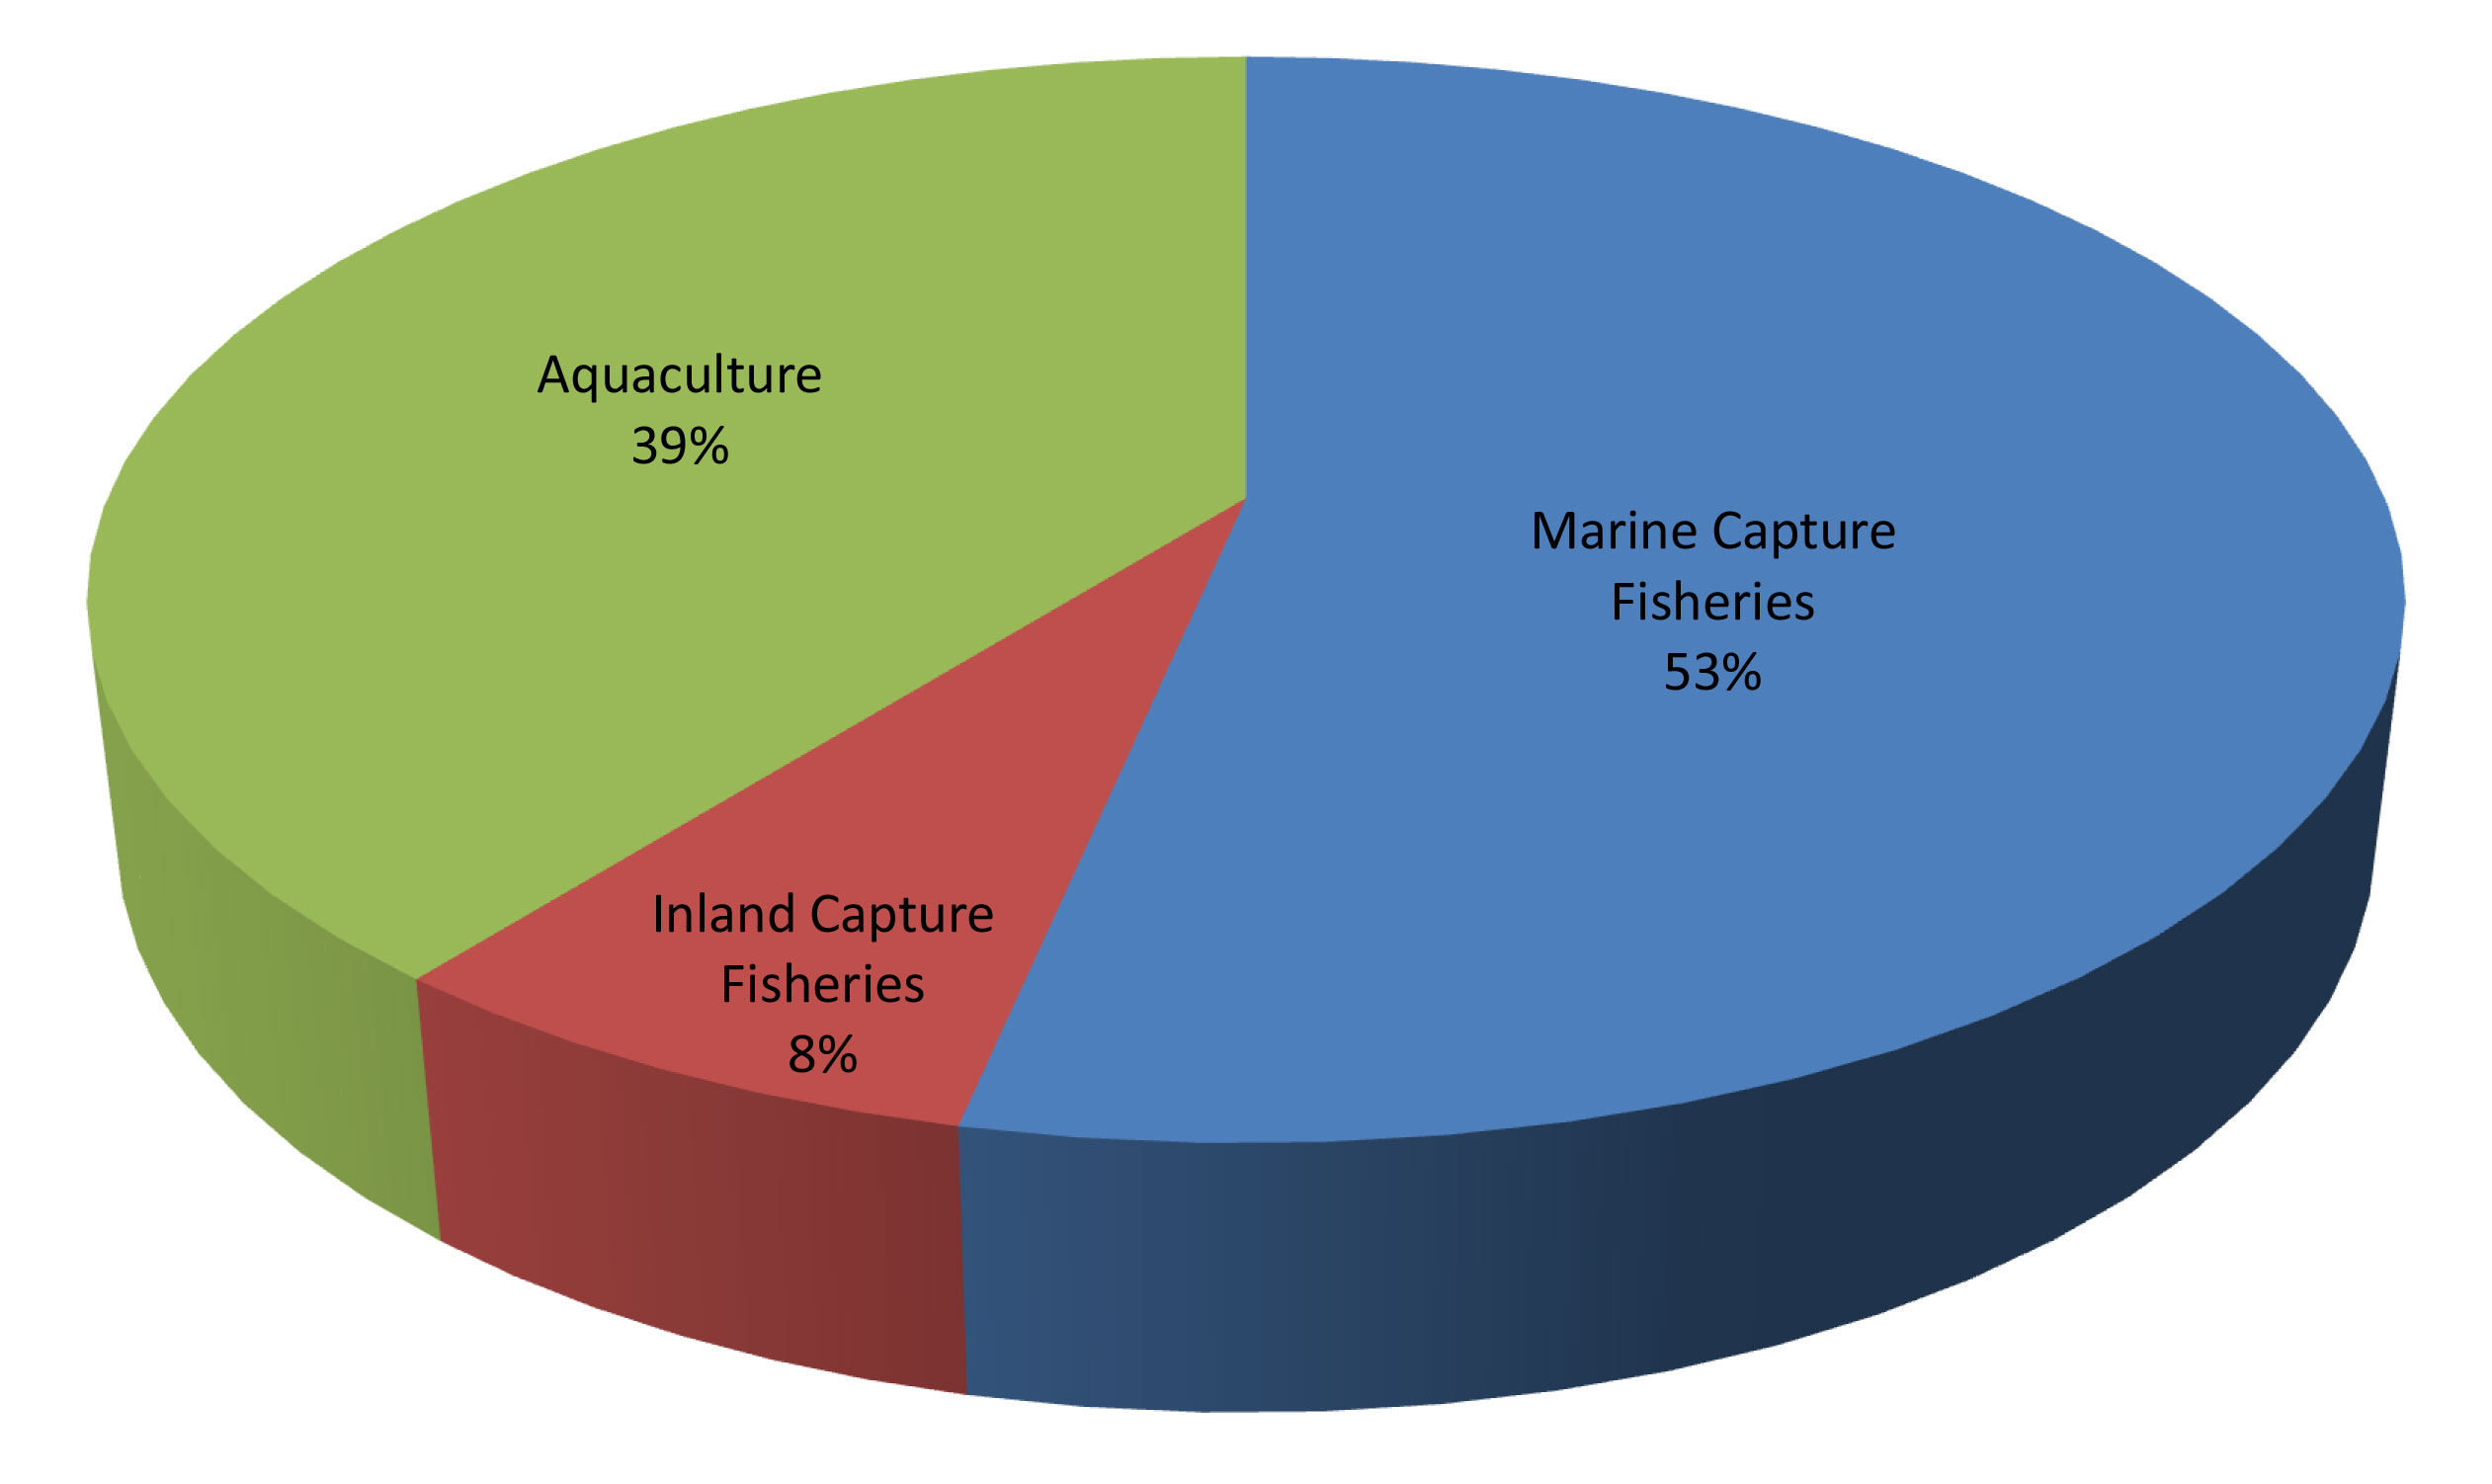
Fig. 2 Percentage of the sub-sectors’ contribution to Southeast Asia’s fishery production in 2019 (left in quantity; right in value)
Marine Capture Fishery Production of Southeast Asia
Table 4. Marine capture fishery production of Southeast Asia by quantity and value (2015-2019)
| Marine capture fishery production |
2015 | 2016 | 2017 | 2018 | 2019 |
| Quantity (MT) | 16,762,393 | 17,027,312 | 17,330,277 | 18,330,325 | 18,167,839 |
| Value (US$ 1,000) | 19,481,510* | 19,939,678* | 25,292,021* | 28,122,606* | 29,343,867* |
* Data not available from Cambodia and Viet Nam
In terms of quantity or volume, the total production from marine capture fisheries of the Southeast Asian countries during 2015-2019 indicated that Indonesia contributed the highest volume to the region’s total production. Specifically, in 2019, Indonesia’s production was 6.42 million MT accounting for approximately 35.3 % of the region’s total, followed by Viet Nam at 3.58 million MT (19.7 %), Myanmar at 3.25 million MT (17.9 %), and Philippines at 1.9 million MT (10.5 %). Malaysia and Thailand had also produced a considerable amount of aquatic commodities from marine capture fisheries at 1.45 million MT (8.0 %) and 1.41 million MT (7.8 %), respectively. A picture of the region’s production volume from marine capture fisheries in 2019 could be gleaned from Figure 3.
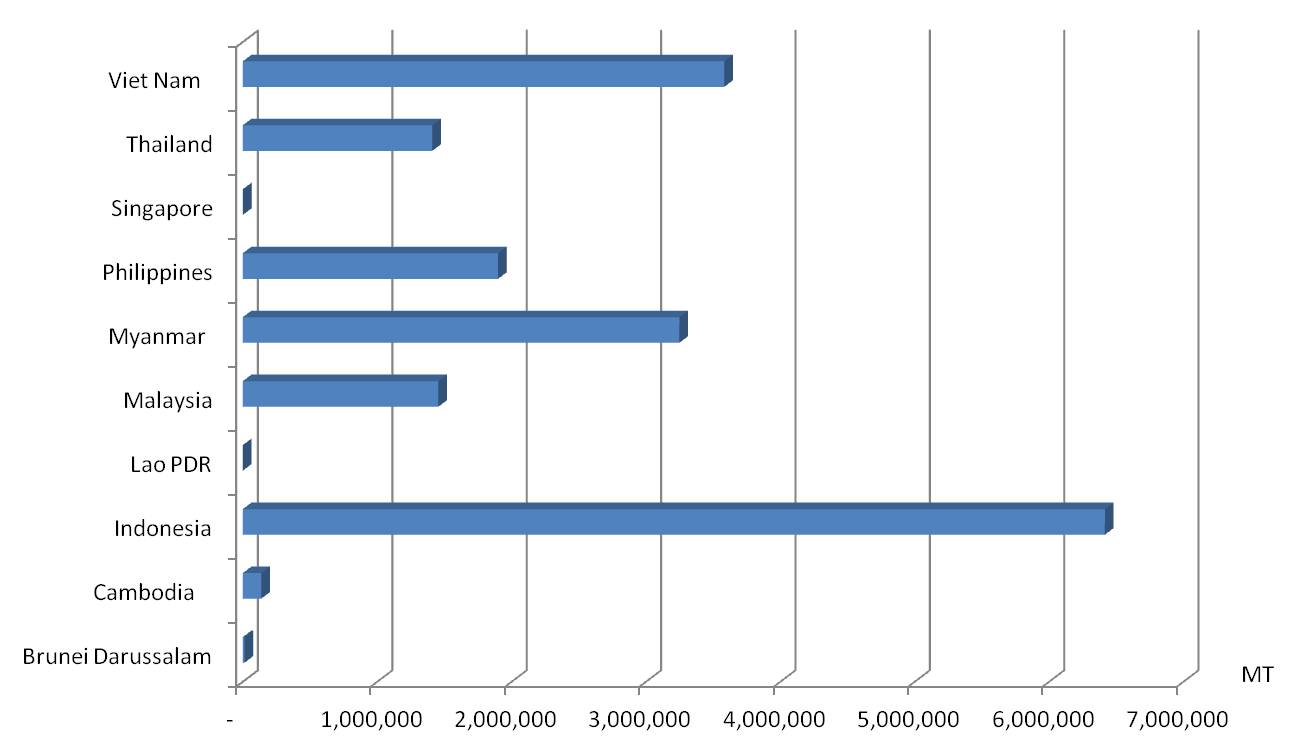
Fig. 3. Marine capture fishery production of Southeast Asia in 2019
Although some Southeast Asian countries were not able to provide the value of their production from marine capture fisheries, the trend of the total value of the region’s marine capture fishery production from 2015 to 2019 seemed to have increased corresponding to the increasing trend of the region’s production volume. By country, Indonesia which led the Southeast Asian countries, accounted for about 55.9 % of the region’s marine capture fishery production value in 2019, with Myanmar emerging second contributing about 18.3 %. Meanwhile, Malaysia which came in third in terms of value contributed about 9.4 %, the Philippines came in fourth at 8.9 %, and lastly, Thailand contributed about 7.3 %. Aggregating the 2019 production volume from marine capture fisheries by major commodity groups, marine fishes provided the highest volume (Table 5) accounting for about 87.3 % followed by mollusks at 5.2 % while the crustaceans, seaweeds, and invertebrates contributed 4.7 %, 0.4 %, and 0.2 %, respectively. It should be noted that 2.1 % was contributed by other commodity groups which could not be appropriately classified as some countries were not able to provide their respective production volume by species. In 2019, the production volume of invertebrates, others, and marine fishes had decreased from that of 2018 by about 64.6 %, 55.1 %, and 0.7 %, respectively, but the production volume of seaweed, mollusks, and crustaceans had increased by about 52.9 %, 49.1 %, and 12.3 %, respectively, compared with the corresponding volume in 2018.
Table 5. Production of the major commodity groups from marine capture fishery in Southeast Asia (in MT)
| Commodity Group | 2015 | 2016 | 2017 | 2018 | 2019 |
| Marine fishes | 14,310,200 | 14,726,719 | 14,880,726 | 15,974,939 | 15,870,138 |
| Crustaceans | 636,342 | 708,248 | 718,355 | 765,095 | 859,449 |
| Mollusks | 532,192 | 540,958 | 830,724 | 564,974 | 940,461 |
| Seaweed | 78,230 | 41,457 | 47,271 | 44,383 | 67,848 |
| Invertebrates | 2,609 | 105,886 | 92,901 | 113,482 | 40,140 |
| Others | 1,202,820 | 904,044 | 760,300 | 867,452 | 389,803 |
| Total marine capture fishery production (MT) |
16,762,393 | 17,027,312 | 17,330,277 | 18,330,325 | 18,167,839 |
Comparing the volume of the total fishery production in 2019 with that of 2018, an increase in production of the marine capture fishery is obvious, which could have been influenced by various factors that include: Viet Nam’s increased production of various major commodities such as tuna-like fishes nei (Scrombroidei) from fishing area 71 , marine crabs nei (Brachyura), natantian decapods nei (Natantia), and production of cephalopods nei (Cephalopoda); Thailand’s production of major marine capture fishery that also increased considerably, especially anchovies, etc. nei (Engraulidae), torpedo scad (Megalaspis cordyla), blackbanded trevally (Seriolina nigrofasciata), and blue swimming crab (Portunus pelagicus), from fishing area 57 and 71; and Myanmar’s increased production of marine fishes nei from fishing area 57.
Moreover, the region’s production of major species such as the Auxis thazard (frigate tuna) and Auxis rochei (bullet tuna) decreased in 2019 compared with that of 2018 which could have been influenced by the reduced production of Indonesia and Philippines; Rastrelliger brachysoma (short mackerel) and Indian mackerel (Rastrelliger kanagurta) production also decreased in 2019 compared with that of 2018 which could have been influenced by decreased production of Indonesia. Meanwhile, production of marine mollusks nei in 2019 had increased compared with that of 2018, which could have been brought about by Viet Nam’s increased production from fishing areas 71.
The economically-important marine species that provided a sizeable contribution to the total fishery production of Southeast Asia from marine capture fisheries (by quantity and value) in 2019 are shown in Table 6. The data indicate that miscellaneous marine fishes (unidentified) contributed the highest volume at about 45.25% and value at about 19.45%. Production from the tunas group contributed about 14.06% to the total production quantity and ranked the second-highest, although it was ranked the highest in terms of value accounting for about 5.49% of the total production value.
The data in Table 6 also suggest that the production value of Scomberomorus spp. (seerfishes nei) is valued the highest among the commodities harvested through marine capture fisheries at US$ 4,891/MT followed by Rastrelliger brachysoma (short mackerel) at US$ 3,623/MT, then Rastrelliger spp. (Indian mackerels nei) at US$ 2,366/MT, crustaceans group, at US$ 2,104/MT, Auxis thazard (frigate tuna) at US$ 2,055/MT, Carangidae (Carangids nei) at US$ 1,762/MT, mollusks group at US$ 1,697/MT, Decapterus spp. (scads nei) at US$ 1,425/MT, Selar crumenophthalmus (bigeye scad) at US$ 1,275/MT, Rastrelliger kanagurta (Indian mackerel) at US$ 1,086/MT, Stolephorus spp. (Stolephorus anchovies) at US$ 1,070/MT, Megalaspis cordyla (torpedo scad) at US$ 995/MT, and Scomberomorus guttatus (Indo-Pacific king mackerel) at US$ 824/MT. The average price of miscellaneous marine fishes (unidentified) which contributed the highest volume in 2019 was estimated at US$ 993/MT, implying that this group must have generated low-value fishes that possibly include trash fishes.
Table 6. Economically-important marine species caught in the region in 2019
| Group/species | Quantity (MT) |
Percentage of total quantity of marine capture fishery production (%) |
Value (US$1,000)* |
Percentage of total value of marine capture fishery production (%) |
Prices (US$/MT)** |
| Tunas and Tuna-like Species Neritic tunas Frigate tuna Bullet tuna Kawakawa Longtail tuna Oceanic tunas Skipjack tuna Southern bluefin tuna Yellowfin tuna Bigeye tuna Tuna-like species Narrow-barred Spanish mackerel Indo-Pacific king mackerel Seerfihes nei Tune-like fishes nei |
2,554,708 4,801 695,456 47,944 |
14.06 |
1,611,148 383,752 39,489 |
5.49 |
734 4,708 1,064 824 |
| Scads Bigeye scad Yellowstripe scad Torpedo scad Indian scad Scads nei Jacks, crevalles nei Carangids nei |
1,608,747 249,895 148,700 94,884 634,431 195,148 162,715 122,974 |
8.85
|
1,135,507 318,533 58,598 94,404 154,147 278,081 15,087 216,657 |
3.87 | 706 1,275 394 995 243 1,425 93 1,762 |
| Mackerels Short mackerel Indian mackerel Indian mackerels nei Mackerels nei |
409,641 53,680 187,161 74,797 94,003 |
2.25
|
666,091 194,497 203,275 45,902 222,417 |
2.27
|
1,626 3,623 1,086 614 2,366 |
| Anchovies Stolephorus anchovies Other anchovies |
277,128 133,910 143,218 |
1.52 | 252,993 143,341 109,652 |
0.86
|
913 1,070 766 |
| Sardines Spotted sardinella Goldstripe sardinella Bali sardinella Rainbow sardines Sardinellas nei |
705,231 26,834 141,722 337,914 24,894 173,867 |
3.88 | 281,267 10,362 19,213 135,997 10,312 105,383 |
0.96 | 399 386 136 402 414 606 |
| Crustaceans | 776,282 | 4.27 | 1,207,515 | 4.11 | 2,104 |
| Mollusks | 939,758 | 5.17 | 1,043,689 | 3.56 | 1,697 |
| Marine fishes unidentified |
8,221,212 | 45.25 | 5,708,407 | 19.5 | 993 |
* Data not available from Cambodia and Viet Nam
** Computation of price excludes corresponding quantity production from Cambodia and Viet Nam
Inland Capture Fishery Production of Southeast Asia
While the Southeast Asian countries reported their respective data on production from inland capture fisheries during 2015-2019, only five countries reported the corresponding production values. Thus, the actual regional production trend of the inland capture fisheries sub-sector could not be established. At any rate, as the consistent top producer, Myanmar maintains a stable inland fishery production from 2015 to 2019 that accounted for 33.0 % of the country’s total production from capture fisheries, 27.0 % of the country’s total fishery production, and 3.4 % of the region’s total fishery production (Table 7). The second highest producer, Indonesia reported a production volume of 649,978 MT in 2019 that represented 9.2 % of the country’s production from capture fisheries, 2.9 % of the country’s total fishery production, and 1.4 % of the region’s total fishery production.
Table 7. Contribution of Southeast Asian countries’ inland capture fisheries to the region’s total fishery production in 2019
| Country | Inland capture production (MT) |
Total capture production (MT) |
% of inland capture production to total capture production |
Total fishery production (MT) |
% of inland capture fishery production to total fishery production |
| Brunei Darussalam |
… | 13,725 | … | 14,658 | … |
| Cambodia | 524,465 | 661,690 | 79.26 | 969,098 | 54.12 |
| Indonesia | 649,978 | 7,066,428 | 9.20 | 22,614,595 | 2.87 |
| Lao PDR | 70,900 | 70,900 | 100 | 183,900 | 38.55 |
| Malaysia | 5,569 | 1,461,015 | 0.38 | 1,872,797 | 0.30 |
| Myanmar | 1,600,050 | 4,849,750 | 32.99 | 5,931,815 | 26.97 |
| Philippines | 154,681 | 2,054,891 | 7.53 | 4,413,129 | 3.51 |
| Singapore | … | 1,418 | … | 7,249 | … |
| Thailand | 116,65 | 1,527,130 | 7.63 | 2,488,833 | 4.68 |
| Viet Nam | 194,700 | 3,777,700 | 5.15 | 8,270,200 | 2.35 |
| Total | 3,316,808 | 21,484,647 | 5.44 | 46,766,274 | 7.09 |
It should be noted however that such production volumes could not be confirmed as accurate considering that most of the countries still need to improve their systems of collecting and compiling their respective fishery statistics, especially with regards to their production from inland capture fisheries.
Only three countries, namely: Indonesia, Philippines, and Thailand, had provided their respective production data from inland capture fisheries by species, while the other countries were not able to report due to inadequacy of expertise in identifying the catch by species. Capacity building in this aspect is, therefore, necessary to enable the countries to compile their respective inland fishery production by major groups of species. Thus, production from inland capture fisheries of Cambodia, Lao PDR, Malaysia, Myanmar, and Viet Nam in 2019 could not be analyzed in terms of species because these countries were not able to provide the breakdown of their production volume by species.
The group of freshwater fishes nei (Osteichthyes) with no species classification provided the highest production from inland capture fisheries accounting for 72.71 % of the region’s total inland capture fisheries production in 2019 (Table 8). As for the major species, production of Nile tilapia (Oreochromis niloticus) was the highest at 3.81 %, followed by striped snakehead (Channa striata) at 2.63 %, torpedo-shaped catfishes nei (Clarias spp.) at 1.44 %, freshwater mollusks nei (Mollusca) at 1.4 0%, and snakeskin gourami (Trichogaster pectoralis) at 1.33 %. As for the production value per volume, the group of freshwater fishes nei (Osteichthyes) was valued the highest among the commodities harvested through inland capture fisheries at US$ 3,602/MT, followed by the Asian redtail catfish (Hemibagrus nemurus) at US$ 2,652/MT, striped snakehead (Channa striata) at US$ 2,636/MT, climbing perch (Anabas testudineus) at US$ 2,477/MT, and common carp (Cyprinus carpio) at US$ 2,174/MT.
Table 8. Production of major inland fisheries species in Southeast Asia in 2019
| Common name | Quantity (MT) |
Percentage total quantity of major inland species to total inland capture production (%) |
Value (US$ 1,000)* |
Percentage total value of major inland species to total inland capture production (%) |
Price (US$/MT)** |
| Misc. fishes | 2,411,779 | 72.71 | 2,604,310 | 64.21 | 3,602 |
| Nile tilapia | 126,268 | 3.81 | 209,575 | 5.17 | 1,660 |
| Striped snakehead |
87,395 | 2.63 | 230,402 | 5.68 | 2,636 |
| Torpedo-shaped catfishes nei |
47,647 | 1.44 | 60,847 | 1.50 | 1,277 |
| Freshwater mollusks nei | 46,471 | 1.40 | 4,727 | 0.12 | 102 |
| Snakeskin gourami | 44,122 | 1.33 | 15,805 | 0.39 | 358 |
| Tilapias nei | 41,802 | 1.26 | 51,835 | 1.28 | 1,240 |
| Climbing perch | 35,452 | 1.07 | 87,830 | 2.17 | 2,477 |
| Common carp | 29,649 | 0.89 | 64,455 | 1.59 | 2,174 |
| Asian redtail catfish | 29,140 | 0.88 | 77,285 | 1.91 | 2,652 |
| Pangasius djambal | 28,397 | 0.86 | 40,835 | 1.01 | 1,438 |
* Data not available from Cambodia, Lao PDR, and Viet Nam
** Computation of price excludes corresponding quantity production from Cambodia, Lao PDR, and Viet Nam
Aquaculture Production of Southeast Asia
The production of spiny eucheuma (Eucheuma denticulatum) of Indonesia as the largest producer of aquaculture product in 2019, contributed 54.50 % to the production volume and 14.30 % to the production value of the country’s aquaculture production. This was followed by Nile tilapia (Oreochromis niloticus) accounting for 9.00 %, Gracilaria seaweeds nei (Gracilaria spp.) at 7.90 %, and torpedo-shaped catfishes (Clarias spp.) at 6.50 %. In the case of Viet Nam, as the second-highest producer from aquaculture, 35.60 % of its aquaculture production came from striped catfish (Pangasianodon hypophthalmus), followed by whiteleg shrimp (Penaeus vannamei) at 12.80 %, freshwater fishes nei (Osteichthyes) at 10.60 %, and cyprinids nei (Cyprinidae) at 9.80 % of the country’s aquaculture production.
For the Philippines as the third-highest producer from aquaculture, its main aquaculture product was the elkhorn sea moss (Kappaphycus alvarezii) contributing 60.30 % to the country’s production from aquaculture, followed by milkfish (Chanos chanos) at 17.40 %, Nile tilapia (Oreochromis niloticus) at 7.40 %, Tilapia nei (Oreochromis (=Tilapia) spp.) at 4.50 %, and spiny eucheuma (Eucheuma denticulatum) at 3.20 %. For Myanmar, its main production from aquaculture was roho labeo (Labeo rohita) which accounted for 33.40 % of the country’s production from aquaculture, followed by common carp (Cyprinus carpio) at 28.10 %, and silver barb (Barbonymus gonionotus) at 24.00 %. Thailand’s main aquaculture product was the whiteleg shrimp (Penaeus vannamei) accounting for 39.40 % of the country’s production from aquaculture, followed by Nile tilapia (Oreochromis niloticus) at 23.80 %, hybrid catfishes (C. gariepinus x C. macrocephalus) at 10.10 %, and barramundi (=giant seaperch) (Lates calcarifer) at 4.90 %. In terms of value per volume of production from aquaculture, Brunei Darussalam had the highest average value at about US$ 7,308/MT (Table 24), followed by Singapore at an average of US$ 6,037/MT, and Thailand about US$ 3,300/MT.
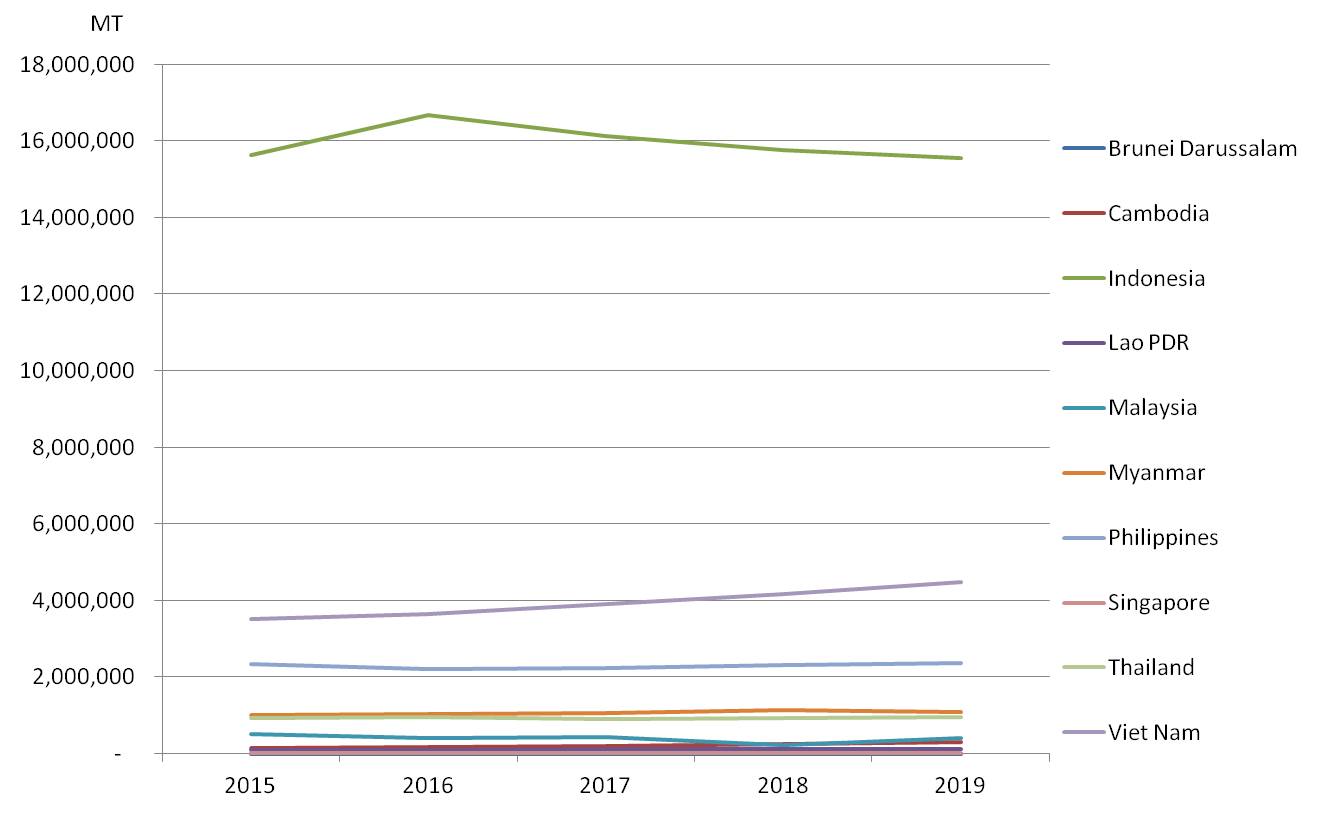
Fig. 4. Trend of the aquaculture production (MT) of the Southeast Asian countries from 2015 to 2019
In terms of the value of the region’s aquaculture production, the actual trend could not be established as some countries were not able to report their data regularly. For the available data in 2019, by value per volume, Brunei Darussalam attained the highest average value at US$ 7,308/MT followed by Singapore at US$ 6,037/MT, Thailand at US$ 3,300/MT, Malaysia at US$ 1,992/MT, Myanmar at US$ 1,702/MT, the
Philippines at US$ 984/MT, and Indonesia at US$ 868/MT. Meanwhile, the value per metric ton of aquaculture production of Cambodia, Lao PDR, and Viet Nam in 2019 could not be calculated as their respective total production values were not reported.
Aquaculture production comes from three culture environments, namely: mariculture, brackishwater culture, and freshwater culture. In 2019, Indonesia as the top producer of aquaculture products of the Southeast Asian region had the highest production from mariculture, followed by Viet Nam from freshwater culture, Philippines from mariculture, Myanmar from freshwater culture, and Thailand from brackishwater culture. In terms of volume, aquaculture in marine areas or mariculture provided 44.0% to the region’s total aquaculture production in 2019 while brackishwater aquaculture contributed 20.0%, and the remaining 36.0% came from freshwater aquaculture. However, in terms of value, mariculture contributed 15.0% while freshwater aquaculture production contributed 42.0%, while brackishwater aquaculture production contributed the highest at 43.0% (Figure 5).
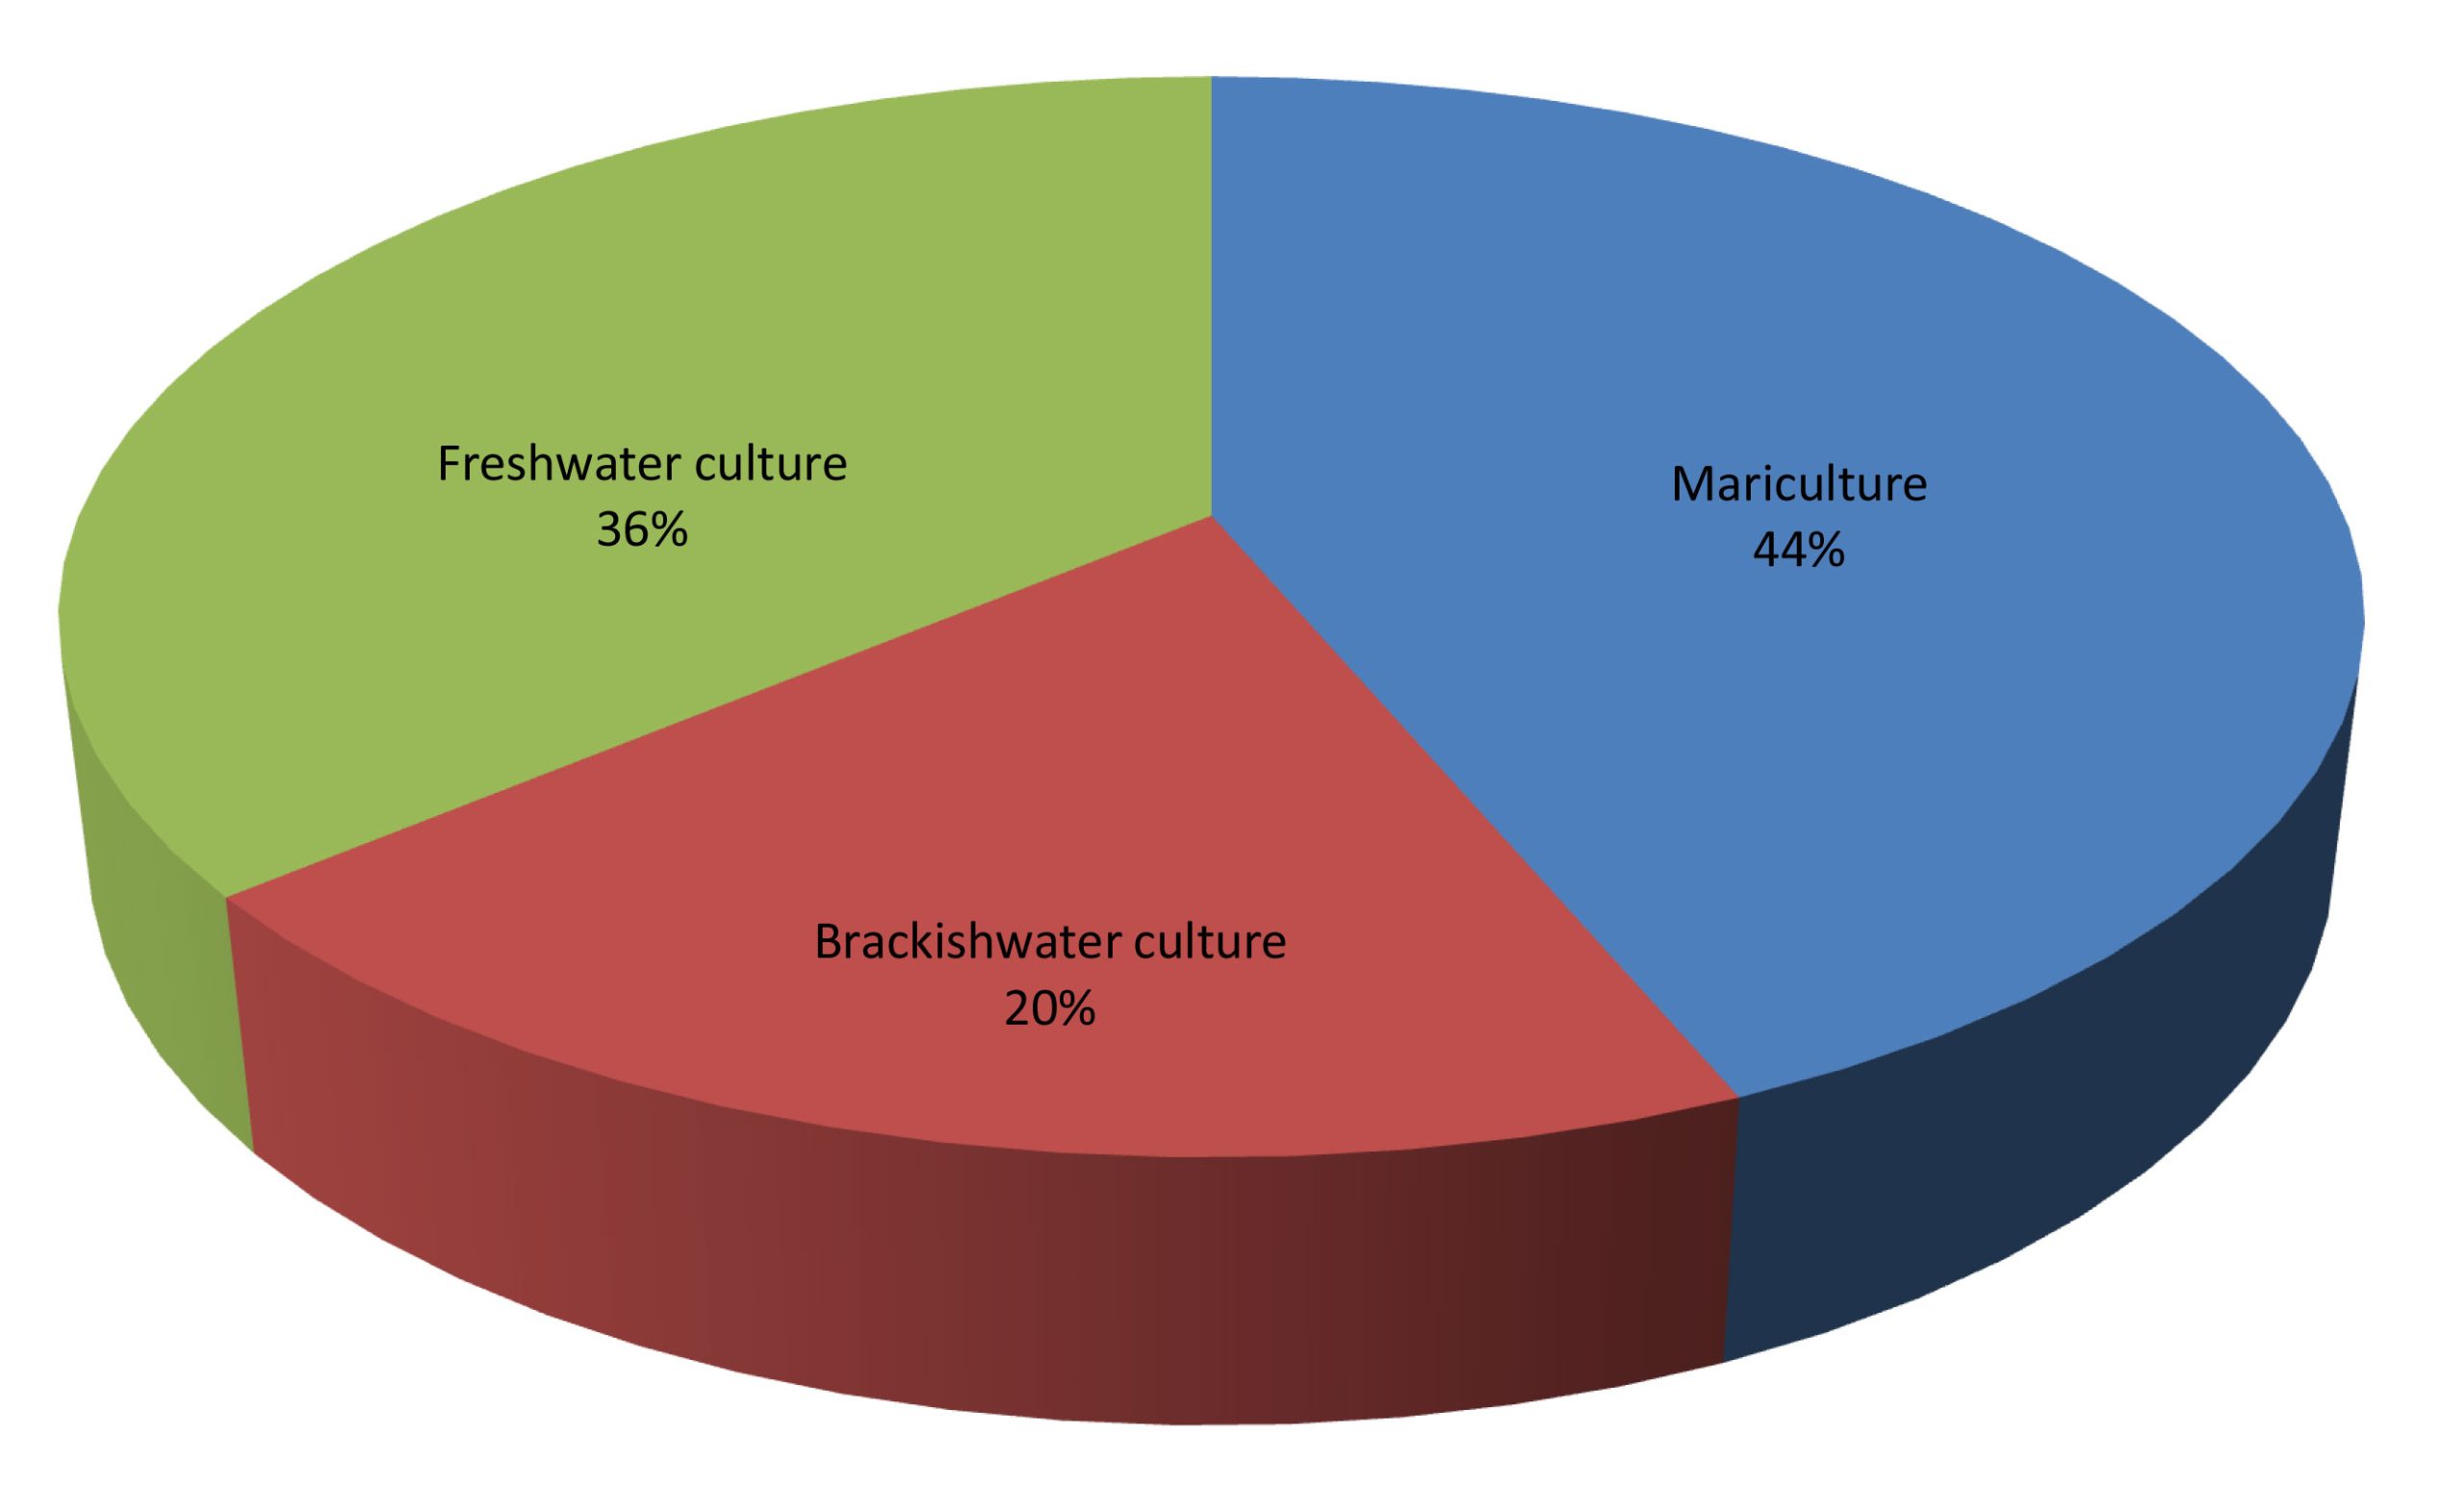
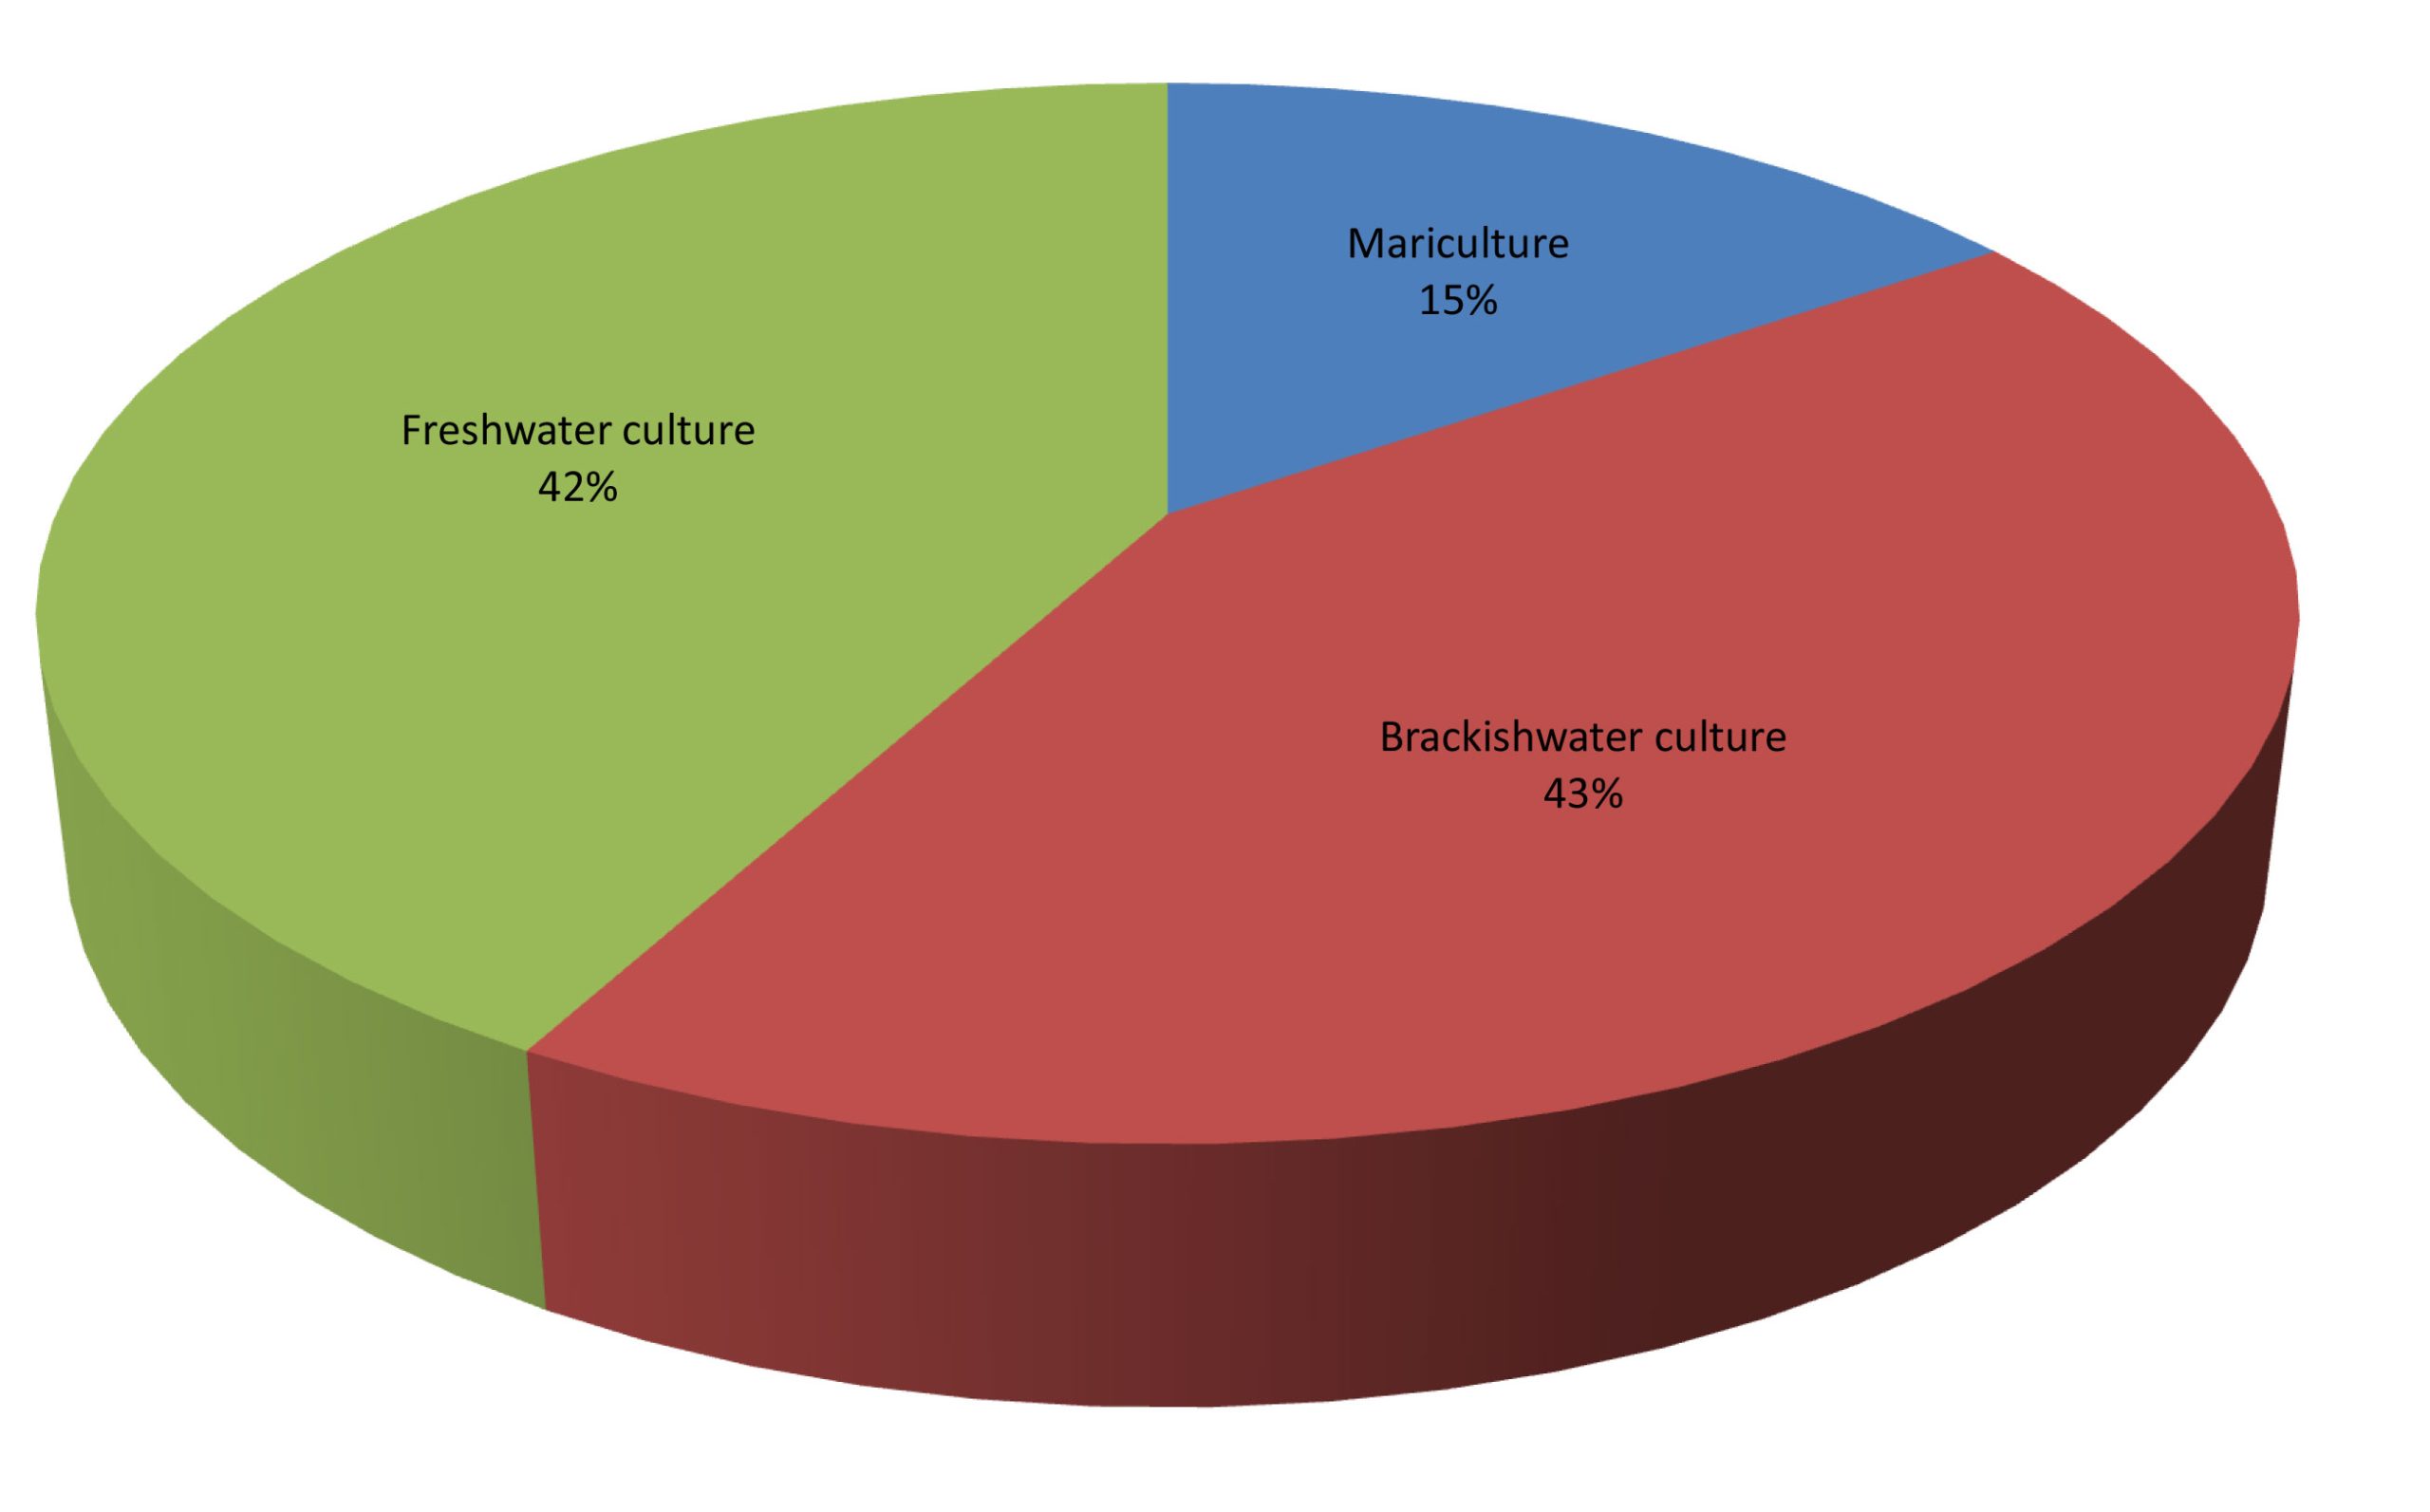
Fig. 5 Percentage of aquaculture production by sub-sector in 2019 (left by quantity: right by value)
It should be recalled that in 2018, production in terms of volume from mariculture accounted for 47.0% of the total aquaculture production, while brackishwater culture production accounted for 16.0% and freshwater culture production at 37.0 %. In terms of value, mariculture contributed 15.0 % to the region’s total aquaculture production value, brackishwater aquaculture production at 44.0 %, and freshwater aquaculture production at 41.0 %. In 2019, the production volume from freshwater aquaculture in 2019 slightly decreased by 1.9 % compared with that of 2018, which could be due to the decreasing volume of the production of Myanma and Viet Nam. Meanwhile, the production value from brackishwater aquaculture slightly increased by 7.5 % from that of 2018 which could be due to the increased production of Eucheuma seaweeds nei (Eucheuma spp.) by Indonesia.
Mariculture
In 2019, the region’s total production in terms of volume from mariculture contributed about 44.0 % to the region’s total aquaculture production and 15.0 % in terms of value. Farmed aquatic plants, such as the spiny eucheuma (Eucheuma denticulatum) and the elkhorn sea moss (Kappaphycus alvarezii), contributed 91.9 % to the region’s total mariculture production volume. Indonesia’s production of the spiny eucheuma (Eucheuma denticulatum) accounted for about 76.6% of the region’s total production volume from mariculture, followed by the elkhorn sea moss (Kappaphycus alvarezii) the main mariculture product of the Philippines which accounted for 12.9%. Specifically for the marine mollusks group, this group contributed about 5.0 % to the region’s total production volume from mariculture, with Viet Nam providing the highest production of marine mollusks nei accounting for about 2.80 %, followed by Thailand whose production of the green mussels (Perna viridis) and blood cockles (Anadara granosa) contributed about 0.30 % each (Figure 6).
In terms of value, the Eucheuma seaweeds nei (Eucheuma spp.) contributed 58.10 % to the region’s total mariculture production followed by shrimps which contributed 10.90 %, milkfish (Chanos chanos) which contributed about 8.50 %, and blood cockle (Anadara granosa) that contributed 5.30 %. Moreover, shrimp commended the highest value per volume at US$ 6,985/MT, followed by blood cockle at US$ 3,000/MT, and milkfish at US$ 2,229/MT. Meanwhile, the lowest value was obtained for the elkhorn sea moss at US$ 72/MT (Table 9).
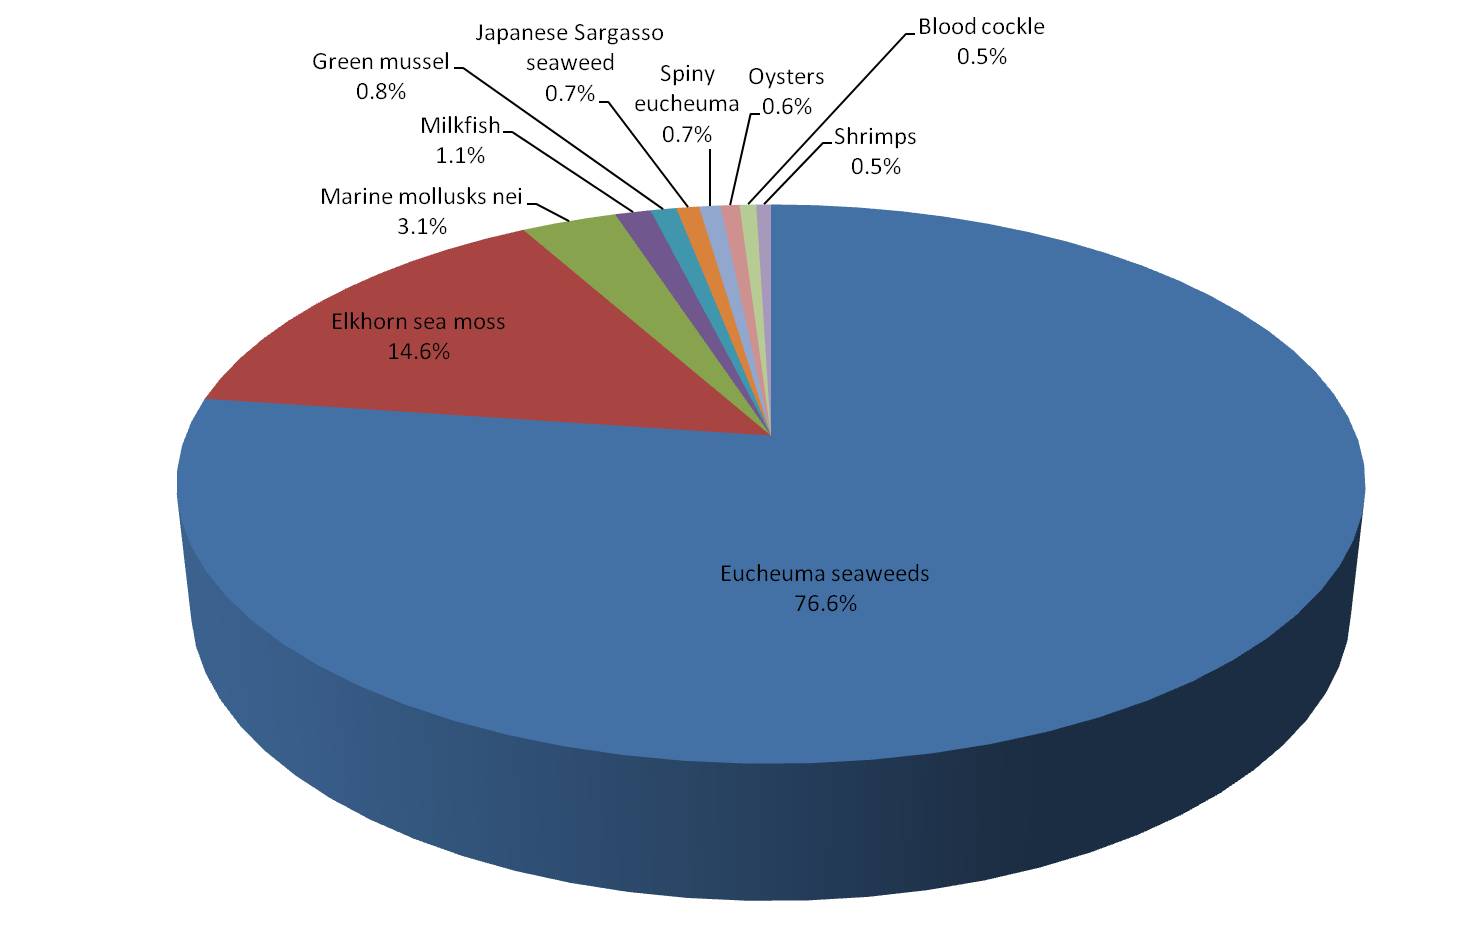
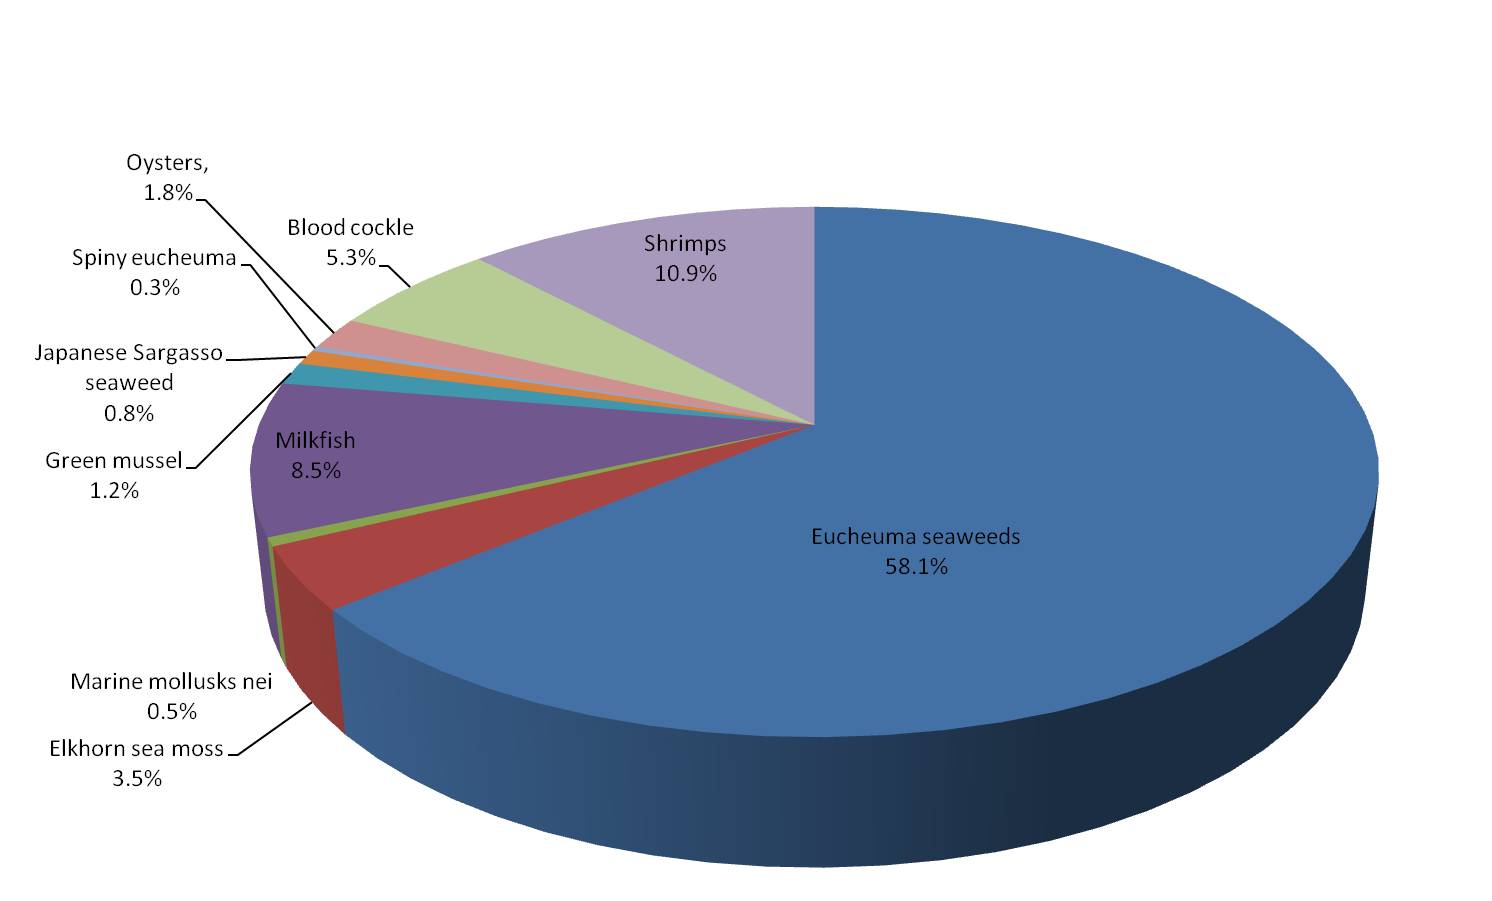
Fig. 6 Mariculture production in 2019 by major species (left by quantity; right by value)
Table 9. Major mariculture species produced in the region (as of 2019)
| Common name | Quantity (MT) |
Percentage production of major commodities from mariculture to total mariculture production (%) |
Value (US$ 1,000) |
Percentage total value of major commodities production from mariculture to total mariculture value (%) |
Price (US$/MT) |
| Eucheuma seaweeds nei | 8,476,045 | 76.6 | 1,936,894 | 58.1 | 229 |
| Elkhorn sea moss | 1,611,289 | 14.6 | 116,154 | 3.5 | 72 |
| Marine mollusks nei | 337,764 | 3.1 | 15,927 | 0.5 | 700 |
| Milkfish | 126,804 | 1.1 | 282,610 | 8.5 | 2,229 |
| Green mussel | 91,130 | 0.8 | 40,981 | 1.2 | 450 |
| Japanese Sargasso seaweed | 80,618 | 0.7 | 27,643 | 0.8 | 343 |
| Spiny eucheuma | 75,619 | 0.7 | 8,587 | 0.3 | 114 |
| Oysters | 66,416 | 0.6 | 60,464 | 1.8 | 910 |
| Blood cockle | 58,719 | 0.5 | 176,167 | 5.3 | 3,000 |
| Shrimps | 51,904 | 0.5 | 362,575 | 10.9 | 6,985 |
As for value per volume of mariculture production in 2019, Brunei Darussalam posted the highest at an average of US$ 8,547/MT from its production of the highly economical species of groupers nei (Epinephelus spp.), followed by Myanmar at US$ 7,082/MT for shrimps, and Singapore at US$ 4,734/MT for its production of the mud spiny lobster (Panulirus polyphagus). Meanwhile, the mariculture production value of Thailand was at US$ 1,892/MT, Philippines at US$ 326/MT, Malaysia at US$ 290/MT, and Indonesia at US$ 250/MT.
Brackishwater Culture
The total production from brackishwater aquaculture in 2019 represented about 20 % of the region’s total production from aquaculture (Figure 7). The major groups and species cultured in brackishwater include crustaceans such as banana prawn (Penaeus merguiensis), giant tiger shrimp (P. monodon), whiteleg shrimp (P. vannamei), and other shrimps, aquatic plants such as Gracilaria spp., as well as fishes such as milkfish (Chanos chanos) and marine fishes, and others. Production of whiteleg shrimps (Penaeus vannamei) mainly produced by Indonesia, Viet Nam, and Thailand had the highest volume representing 33.0 % of the region’s total production from brackishwater aquaculture. The second highest was contributed by Gracilaria seaweeds (Gracilaria spp.) at 24.1 % mainly produced by Indonesia, and the third came from milkfish (Chanos chanos) at 19.5% mainly produced by Indonesia and the Philippines. Meanwhile, the giant tiger prawn (Penaeus monodon) contributed 9.0 % mainly from Viet Nam and Indonesia; the group of fishes provided 6.8 %; and shrimps at 1.9 %. In terms of production value, the whiteleg shrimp (P. vannamei) contributed the highest value of about 54.80 % which was provided by Indonesia and Thailand, followed by milkfish (Chanos chanos) from Indonesia and Philippines contributing at 16.10 %, giant tiger shrimp (P. monodon) from Indonesia, the Philippines, Thailand, and Malaysia at 15.10 %, and marine fishes at 8.00 %. Although aquatic plants attained the second-highest production volume (24.00 %), its contribution in terms of value was only 1.00 %
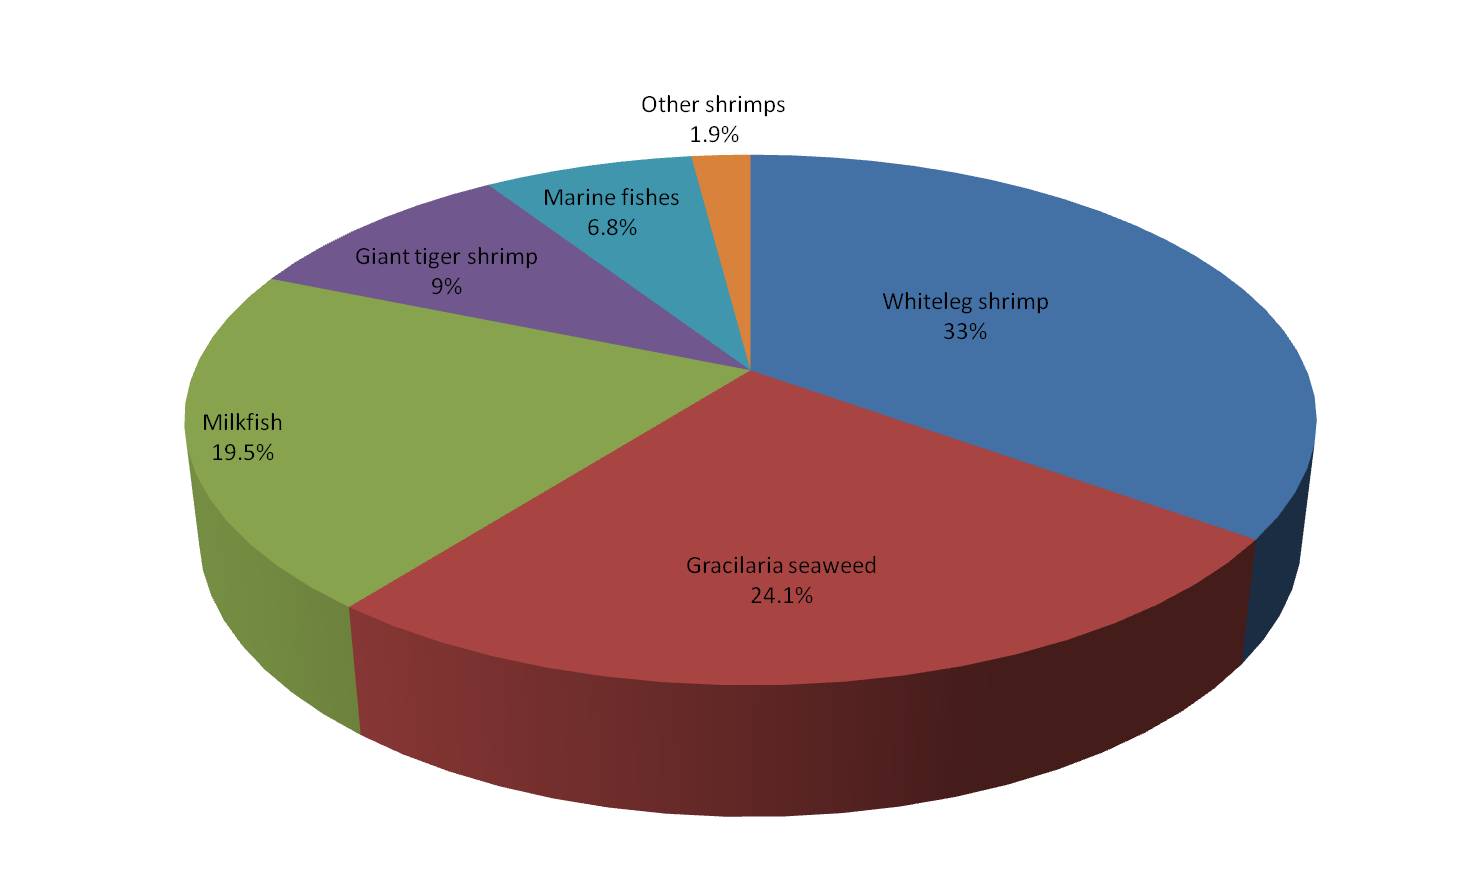
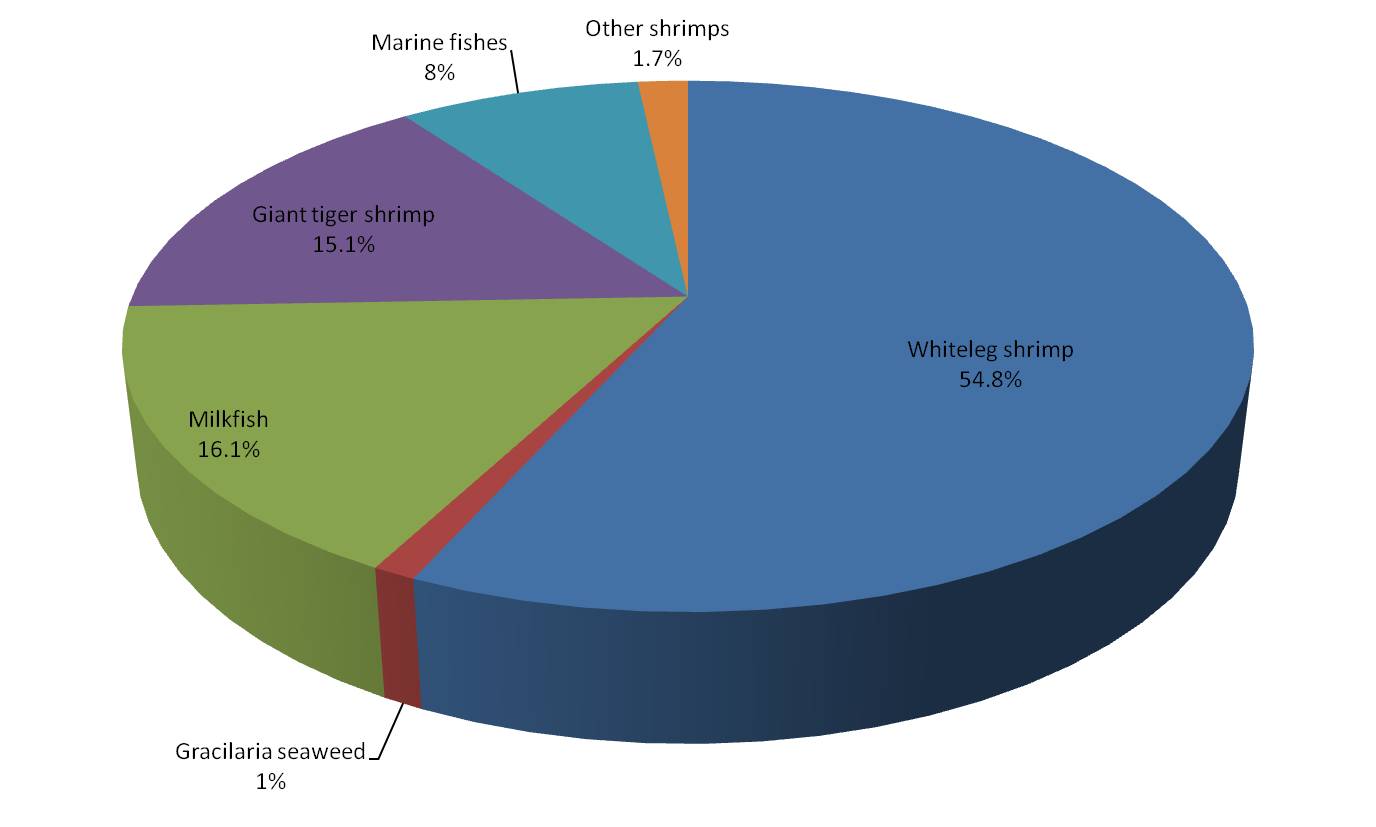
Fig. 7 Brackishwater culture production in 2019 by species (left by quantity; right by value)
On the average value per volume of production from brackishwater aquaculture, considering only the countries that reported their respective production values, Singapore posted the highest at US$ 28,267/MT followed by Brunei Darussalam at US$ 6,618/MT, Malaysia at US$ 6,087/MT, Thailand at US$ 4,866/MT, Philippines at US$ 3,523/MT, Indonesia at US$ 1,732/MT, and Myanmar at US$ 1,300/MT. Cambodia and Viet Nam did not report their respective production value from brackishwater aquaculture. The highest value per volume of production was attained by the giant tiger shrimp (P. monodon) at US$ 7,057/MT followed by whiteleg shrimp (P. vannamei) at US$ 4,592/MT, other shrimps at US$ 2,962/MT, group of fishes at US$ 2,238/MT, milkfish (Chanos chanos) at US$ 1,495/MT, and Gracilaria spp. at US$ 77/MT (Table 10).
Table 10. Major brackishwater species cultured in the region (as of 2019)
| Common name | Quantity (MT) |
Percentage brackishwater culture production of major commodities to total brackishwater culture production (%) |
Value (US$ 1,000)* |
Percentage total value of major commodities production from brackishwater culture to total brackishwater culture value (%) |
Price (US$/MT)** |
| Whiteleg shrimps | 1,678,302 | 33.0 | 5,056,968 | 54.8 | 4,592 |
| Gracilaria seaweeds | 1,223,648 | 24.1 | 94,800 | 1.0 | 77 |
| Milkfish | 992,195 | 19.5 | 1,483,073 | 16.1 | 1,495 |
| Giant tiger shrimp | 458,325 | 9.0 | 1,392,428 | 15.1 | 7,057 |
| Misc. fishes | 343,606 | 6.8 | 736,466 | 8.0 | 2,238 |
| Shrimps | 96,645 | 1.9 | 152,959 | 1.7 | 2,962 |
* Data not available from Cambodia and Viet Nam
** Computation of price excludes corresponding quantity production from Cambodia and Viet Nam
Freshwater Culture
The region’s total production from the freshwater culture in 2019 accounted for about 36.0% of the region’s total production from aquaculture, a slight decrease of about 1.9% from that of the 2018 production volume. In 2019, Indonesia had the highest production from freshwater aquaculture at 3,925,503 MT or 43.00 % to the region’s total freshwater aquaculture production, followed by Viet Nam at 2,983,829 MT or 32.70 %, Myanmar at 959,744 MT or 10.50 %, Thailand at 426,949 MT or 4.70 %, Philippines at 320,977 MT or 3.50 %, Cambodia at 290,180 MT or 3.17 %, Malaysia at 115,285 MT or 1.3 %, and Lao PDR at 113,000 MT or 1.3 %.
Having accounted for 42.0% of the region’s total aquaculture production value in 2019, the freshwater culture sub-sector had emerged as a very important fisheries sub-sector, notwithstanding the increase of its production value by almost 12.7% in 2019 compared with that of 2018. This information, however, should not be underestimated considering that the corresponding production values from Cambodia, Lao PDR, and Viet Nam had not yet been reported.
In terms of production volume from freshwater aquaculture by species of the Southeast Asian countries (Figure 8), pangas catfishes nei (Pangasius spp.) accounted for 21.90 % of the region’s total production from freshwater aquaculture, which was contributed mainly by Viet Nam. This was followed by Nile tilapia (Oreochromis niloticus) which accounted for 19.70 % and contributed mainly by Indonesia, followed by torpedo-shaped catfishes (Clarias spp.) at 11.60 % contributed mainly by Indonesia, common carp (Cyprinus carpio) at 11.40 % contributed mainly by Indonesia, Myanmar, and Viet Nam, tilapias nei (Oreochromis(=Tilapia) spp.) for 4.70 % contributed mainly by Viet Nam, cyprinids nei for 4.50 % accounted mainly by Viet Nam, roho labeo (Labeo rohita) at 4.10 % contributed mainly by Myanmar, silver barb (Barbonymus gonionotus) at 3.30 % accounted mainly by Myanmar, giant gourami (Osphronemus goramy) accounted for 2.10 % contributed mainly by Indonesia, and Africa-bighead catfish, hybrid (Clarias gariepinus x C. macrocephalus) at 1.10 % contributed mainly by Thailand.
On production value, the highest contributor to the region’s total production value from freshwater aquaculture in 2019 was Nile tilapia (Oreochromis niloticus) which accounted for 32.50 % of the region’s total production from freshwater aquaculture, followed by common carp (Cyprinus carpio) at 16.80 %, torpedo-shaped catfishes (Clarias spp.) at 13.80 %, roho labeo (Labeo rohita) at 6.90 %, pangas catfishes nei (Pangasius spp.) at 6.00 %, giant gourami (Osphronemus goramy) at 4.90 %, giant river prawn (Macrobrachium rosenbergii) at 3.70 %, and tilapias nei (Oreochromis(=Tilapia) spp.) at 3.10 %. For the value per volume of major freshwater aquaculture species, the highest was earned by giant river prawn (Macrobrachium rosenbergii) at US$ 7,006/MT followed by giant gourami (Osphronemus goramy) at US$ 2,312/MT, roho labeo (Labeo rohita) at US$ 1,690/MT, common carp (Cyprinus carpio) at US$ 1,678/MT, tilapias nei (Oreochromis(=Tilapia) spp.) at US$ 1,675/MT, Nile tilapia (Oreochromis niloticus) at US$ 1,641/ MT, Africa-bighead catfish, hybrid (Clarias gariepinus x C. macrocephalus) at US$ 1,484/MT, milkfish (Chanos chanos) at US$ 1,433/MT, pangas catfishes nei (Pangasius spp.) at US$ 1,380/MT, miscellaneous freshwater fishes at US$ 1,309/MT, torpedo-shaped catfishes (Clarias spp.) at US$ 1,191/MT, silver barb (Barbonymus gonionotus) at US$ 1,057/MT, and cyprinids nei at US$ 481/MT (Table 11).
Furthermore, for the value of production from freshwater culture by country, Singapore presented the highest average value at US$ 7,538/MT mainly coming from its production of the Nile tilapia (Oreochromis niloticus). This was followed by Brunei Darussalam at US$ 6,000/MT mainly for its production of the Nile tilapia (Oreochromis niloticus), Thailand at US$ 1,958/MT main for its production of Nile tilapia Malaysia at US$ 1,762/MT also for its production of tilapias nei (Oreochromis(=Tilapia) spp.), Indonesia at US$ 1,572/ MT, Philippines at US$ 1,550/MT, and Myanmar at US$ 1,435/MT.
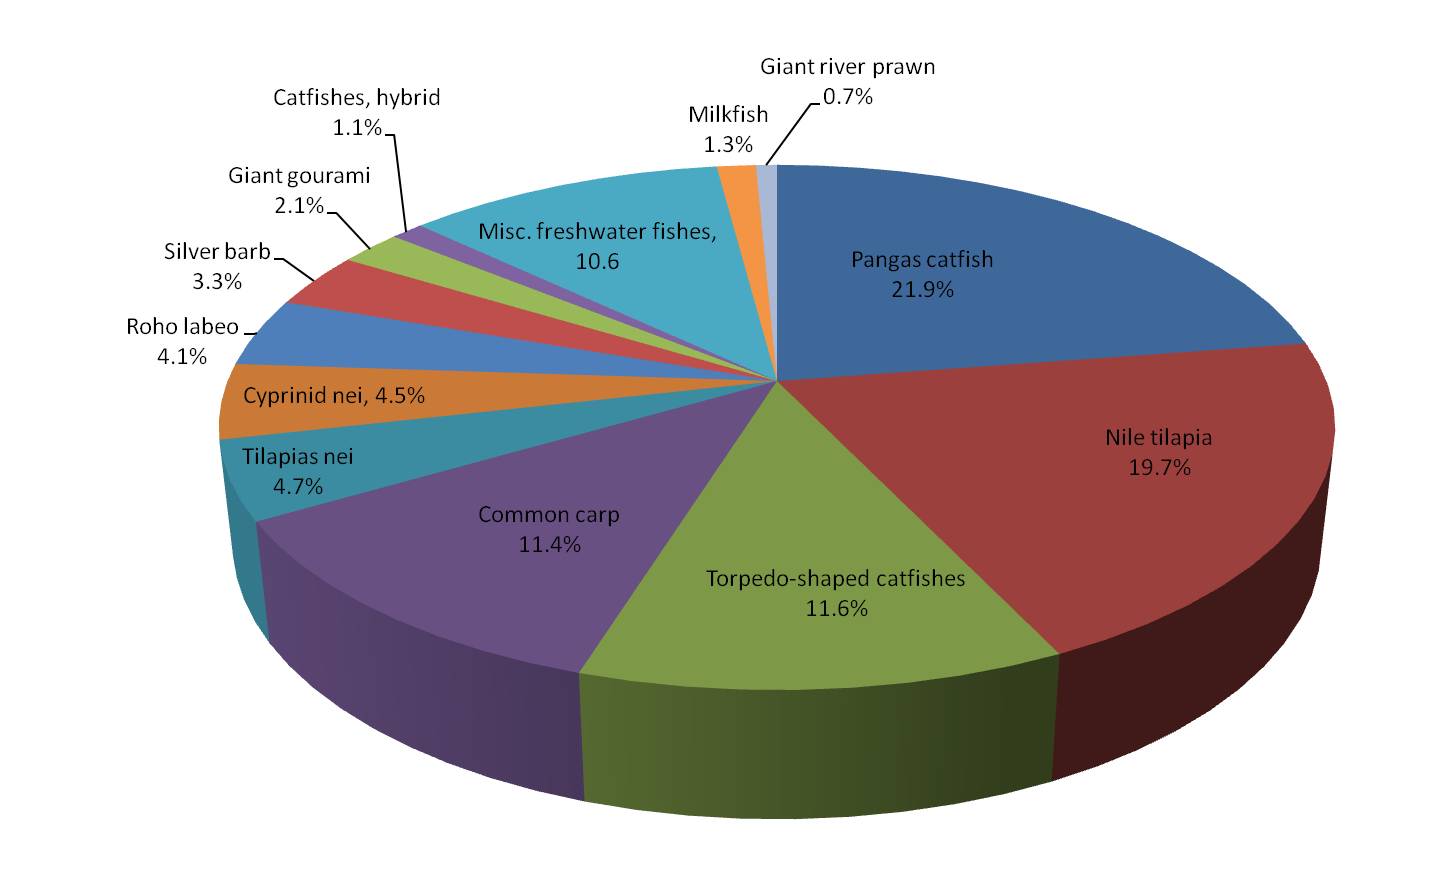
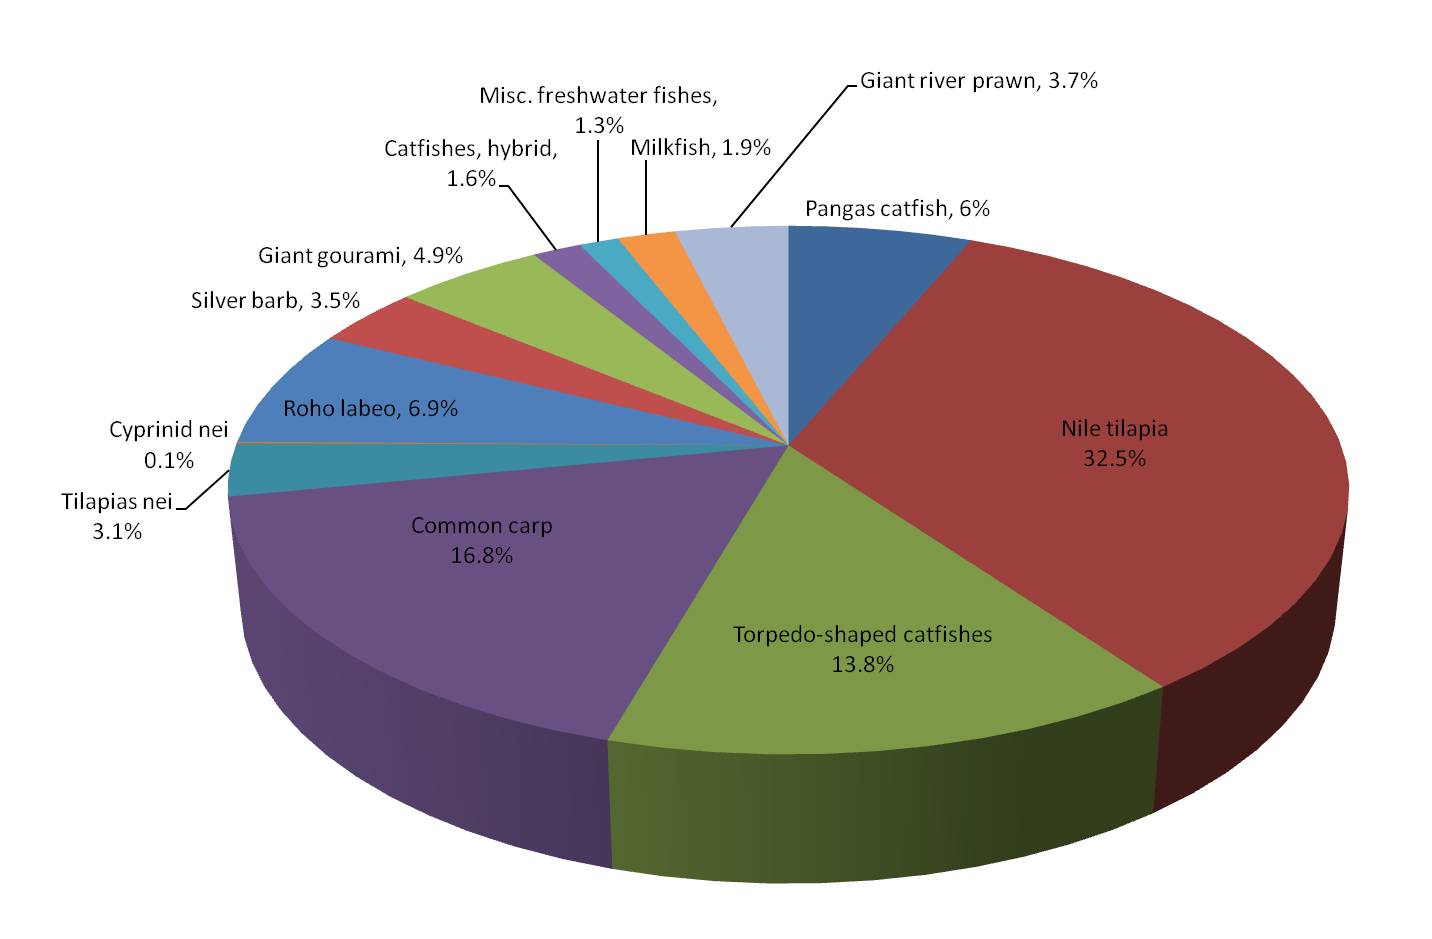
Fig. 8. Production of major freshwater culture species in 2019 (by quantity (left) and value (right))
Table 11. Major freshwater species cultured in the region (as of 2019)
| Common name | Quantity (MT) |
Percentage freshwater culture production of major commodities to total freshwater culture production (%) |
Value (US$ 1,000)* |
Percentage total value of major commodities production from freshwater culture to total freshwater culture value (%) |
Price (US$/MT)** |
| Pangas catfishes nei |
1,997,171 | 21.9 | 548,074 | 6.0 | 1,380 |
| Nile tilapia | 1,801,127 | 19.7 | 2,956,238 | 32.5 | 1,641 |
| Torpedo-shaped catfishes |
1,056,921 | 11.6 | 1,258,394 | 13.8 | 1,191 |
| Common carp | 1,045,676 | 11.4 | 1,529,652 | 16.8 | 1,678 |
| Tilapias nei | 429,334 | 4.7 | 278,391 | 3.1 | 1,675 |
| Cyprinid nei | 412,819 | 4.5 | 6,160 | 0.1 | 481 |
| Roho labeo | 371,997 | 4.1 | 628,625 | 6.9 | 1,690 |
| Silver barb | 304,056 | 3.3 | 321,284 | 3.5 | 1,057 |
| Giant gourami | 193,197 | 2.1 | 446,744 | 4.9 | 2,312 |
| Catfishes, hybrid | 97,151 | 1.1 | 144,193 | 1.6 | 1,484 |
| Misc. fishes | 969,794 | 10.6 | 119,378 | 1.3 | 1,309 |
| Milkfish | 118,227 | 1.3 | 169,377 | 1.9 | 1,433 |
| Giant river prawn | 67,659 | 0.7 | 332,987 | 3.7 | 7,006 |
* Data not available from Cambodia, Lao PDR, and Viet Nam
** Computation of price excludes corresponding quantity production from Cambodia, Lao PDR, and Viet Nam
Fishing Gear Analysis
As the highest producing fishing gear, trawls accounted for about 46.0% of the total production from all types of gears, followed by the purse seines at about 26.5 %, gill nets at 13.5 %, falling net at 4.5 %, others at 3.0 %, hook and lines at 2.0 %, lift net at 1.3 %, traps at 1.2 %, push/scoop nets at 1.1 %, and seine nets at 1.0 %. However, the trend on gear used in marine capture fisheries could not be appropriately analyzed as several countries such as Cambodia, Indonesia, Malaysia, Myanmar, Philippines, and Viet Nam were not able to provide the necessary information.
From such information, the highest production by type of gears in Brunei Darussalam was from purse seine which accounted for about 78.1% of the total production of all types of gears, with yellowfin tuna (Thunnus albacares) and scads nei (Decapterus spp.) as the main catch. This was followed by trawls at 12.6% catching cuttlefishes nei (Sepia spp.), gillnet at 3.6% catching frigate and bullet tunas (Auxis thazard, A. rochei), hook and lines at 2.9% catching yellowfin tuna (Thunnus albacares) as the main catch.
For Malaysia, trawls gave the highest production by type of gears at about 46.3 % with trash fishes about 32.9%, lizard fishes nei (Saurida spp.) about 7.3 %, common squids nei (Loligo spp.) about 5.9%, paste shrimp (Acetes spp.) about 4.9%, and threadfin breams nei (Nemipterus spp.) about 4.6%. Purse Seine came in second high ranking at 24.4% catching scads nei (Decapterus spp.) about 17.1 %, longtail tuna (Thunnus tonggol) about 11.0 %, Indian mackerels nei (Rastrelliger spp.) about 9.8%, trash fishes about 8.5, Sardinellas nei (Sardinella spp.) about 7.1%, and torpedo scad (Megalaspis cordyla) about 6.6%.
For Thailand, trawls gave the highest production by type of gears at about 45.2 % and producing mainly trash fishes that represented about 45.9 %, marine fishes nei at about 10.0 %, common squids nei (Loligo spp.) about 6.0 %, and threadfin breams nei (Nemipterus spp.) about 5.0 %. Purse seines came in second contributing 28.2 % to the production from all types of gears catching Sardinellas nei (Sardinella spp.) representing about 13.4 %, Stolephorus anchovies (Stolephorus spp.) about 12.2 %, scads nei (Decapterus spp.) about 12.1 %, Indian mackerel (Rastrelliger kanagurta) about 11.0%, and jack, crevalles nei (Caranx spp.) of about 7.4 %.
In the case of Singapore, trawls gave the highest production by type of gears at about 100.0 % with penaeid shrimps nei (Penaeus spp.) accounting for about 15.3 %, marine fishes nei about 10.6%, snappers nei (Lutjanus spp.) about 8.1 %, and stingrays nei (Dasyatis spp.) of about 5.9 %.
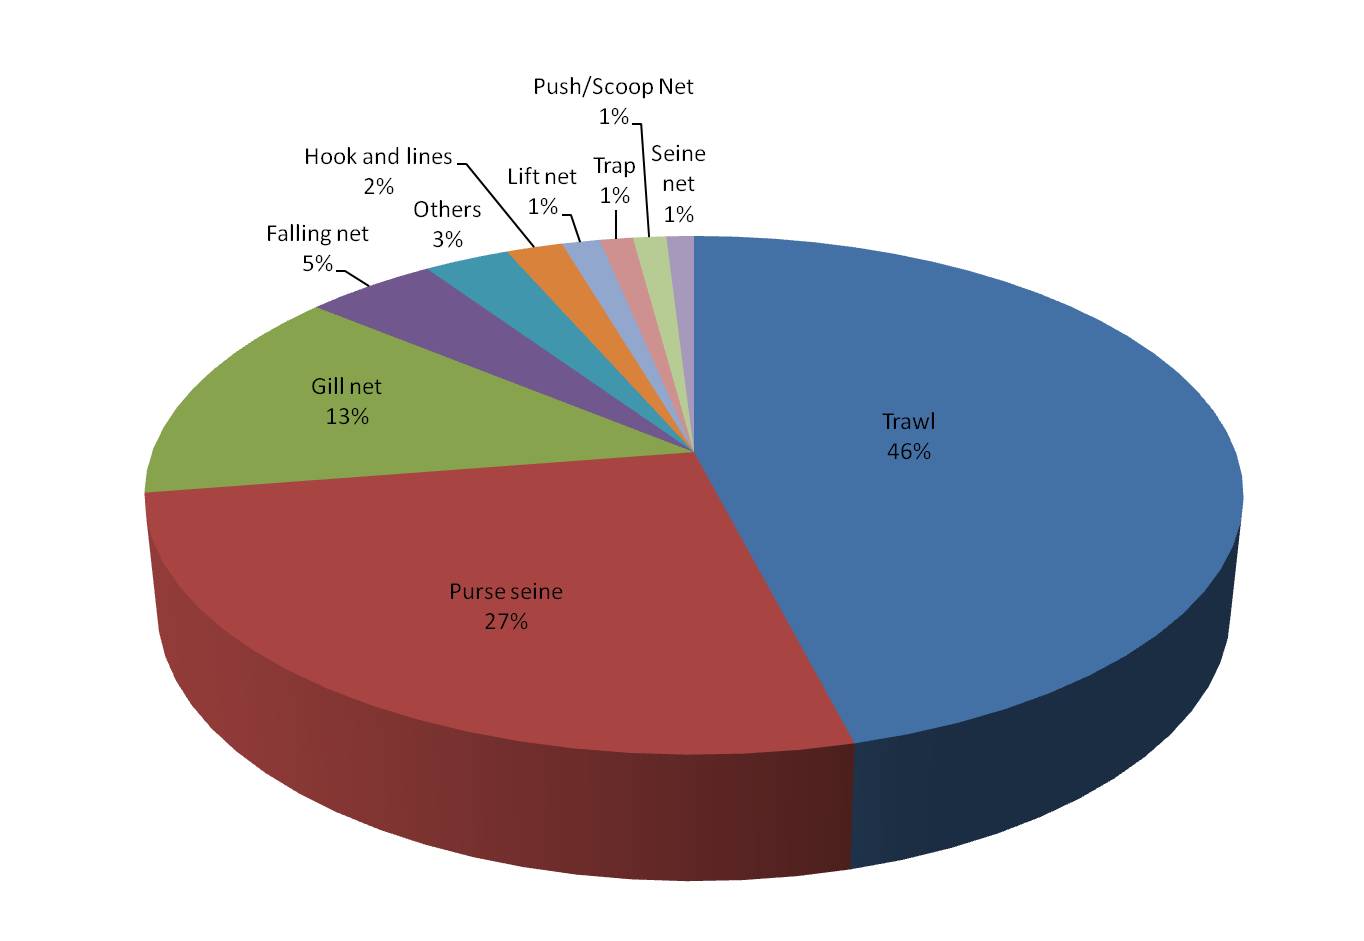
Fig. 9. Marine capture fishery production by type of gear used in 2019
Number of Fishing Boats by Type
boats, and Singapore with 34 boats.
Number of Fishers by Working Status
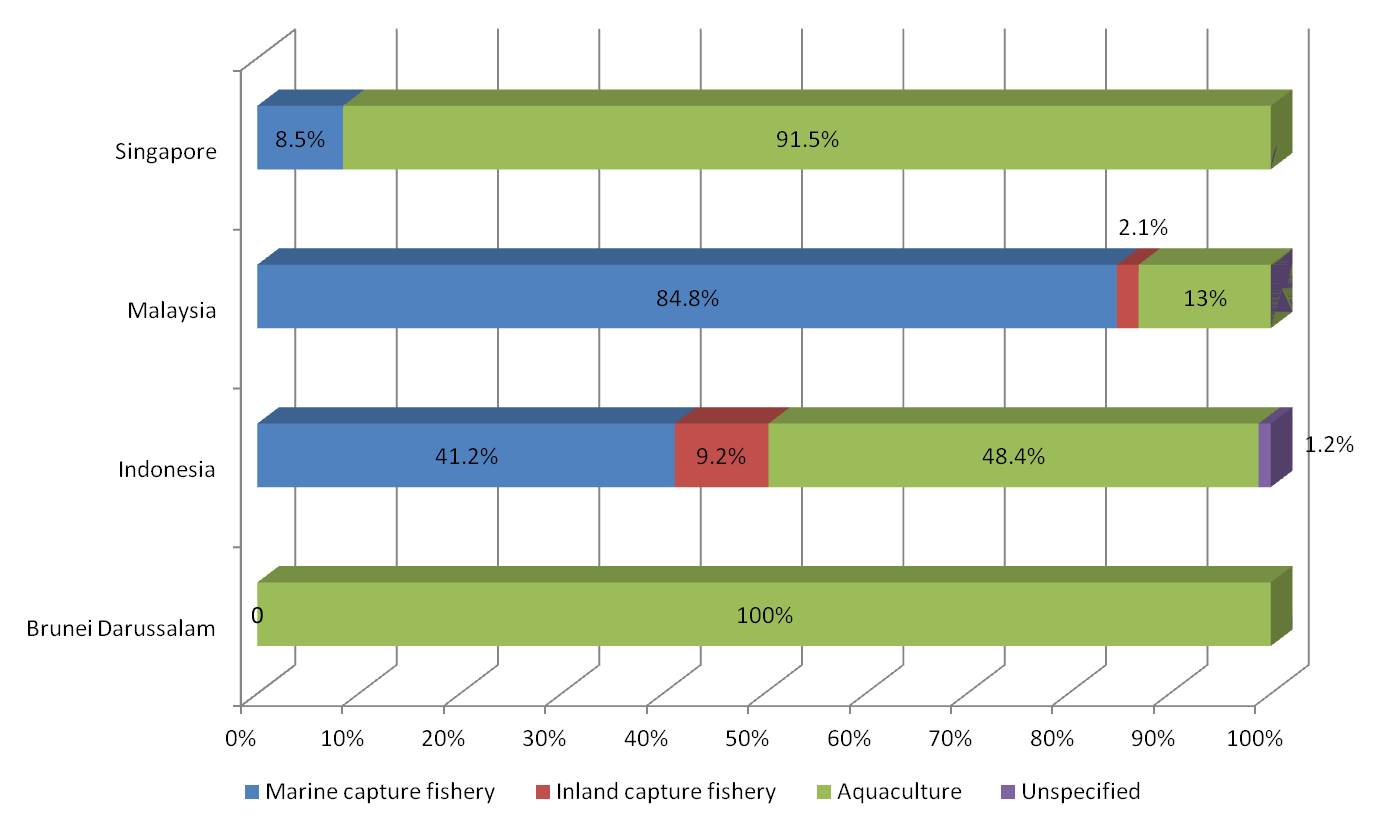
Fig 10. Percentage of fishers by working status in 2019
Efforts to improve the data availability and statistics in support of all efforts to compile the data and information should therefore be intensified by encouraging the countries to enhance the reporting of small-scale fisheries operations through the conduct of census and surveys using questionnaires. This would enable the countries to compile the necessary data and information on fisheries not only on the number of fishers and fish farmers but also the number of fishing vessels and gear used in fishing operations.
Aquaculture Production of Ornamental Fishes
In terms of value, Myanmar reported the highest value which was obtained from Channa pulchra at US$ 0.56/pc followed by Burmese snakehead (Channa harcourtbutleri) at US$ 0.5/pc, Channa burmanica at US$ 0.5/pc, Garra flavatra at US$ 0.32/pc, Channa panaw at US$ 0.3/pc, Toxotes blythii at US$ 0.3/pc, Botia kubotai at US$ 0.25/pc, and Danio margaritatus at US$ 0.24/pc. Malaysia reported value that the country obtained was for the osteoglossids at US$ 32.53/pc, followed by chichlids at US$ 3.06/pc, callichthyids at US$ 1.83/pc, anabantids at US$ 0.43/pc, cyprinids at US$ 0.24/pc, and characins at US$ 0.23/pc. Brunei Darussalam reported value that the country obtained was for goldfish (Carassius auratus) at US$ 21.6/pc, chichlids at US$ 7.2/pc, Pterophyllum altum at US$ 3.6/pc, and cyprinids at US$ 2.16/pc. In order to have a better picture of the ornamental fish culture industry in Southeast Asia, efforts would be made to improve
the compilation of data from this sub-sector considering that this is a budding industry in the region.
Seed Production for Aquaculture
region’s aquaculture industry. Thus, a compilation of the said information was initiated by SEAFDEC in 2008 although at that time only four countries responded and provided the relevant information, i.e. Cambodia, Malaysia, Myanmar, and Singapore. Brunei Darussalam started to provide the necessary information in 2009, and every year thereafter until 2017 except in 2010. Cambodia started providing the necessary data in 2008 and 2009 but did not provide the data for 2010 to 2014. Cambodia again provided the data for 2015 and 2016, but not for 2017. Indonesia started to provide the necessary data in 2010 and continued until 2014, but no data were provided for 2015 until 2017. Malaysia started providing the data in 2008, and every year thereafter until 2019 except in 2018. Myanmar started to provide the necessary data in 2008, and every year thereafter until 2014, and although it did not provide data for 2015 and 2016, the necessary data were provided for this current issue of the Bulletin. Singapore started to provide the necessary data in 2008 and every year thereafter until this issue of the Bulletin, except in 2014. For the subsequent issues of this Bulletin, efforts would be exerted to gather the said information from all the Southeast Asian countries, e.g. Lao PDR, Philippines, Thailand, and Viet Nam, would be encouraged to provide the necessary data. Once all Southeast Asian countries can provide the necessary data, the true picture of this significant niche of the aquaculture industry could be established.
Analysis of Producer Price of Commodities From Capture Fisheries
Meanwhile, the producer price situation in 2019 for certain economically important species of Southeast Asia shows that for inland fish species, the producer price of common carp, Cyprinus carpio in Myanmar was recorded at US$ 2.41/kg while it was US$ 1.45/kg in Thailand. For the Nile tilapia, Oreochromis niloticus the producer price in Malaysia was US$ 2.19/kg compared to Myanmar’s US$ 1.32/kg. For torpedo-shaped catfishes nei (Clarias spp.) in Myanmar was US$ 3.29/kg compared to Malaysia’s US$ 1.39/kg. The producer price of marble goby (Oxyeleotris marmorata) in Malaysia was quite high at US$ 14.91. For other freshwater prawns (Palaemonidae), the producer price in Thailand was quite high at US$ 28.99/kg.
For marine fish species, the producer price of Barramundi (giant sea perch), Lates calcarifer in Singapore was US$ 7.52/kg compared to Malaysia’s US$ 4.34/kg. Saurida spp. in Singapore was priced at US$ 3.21/ kg compared to Malaysia’s US$ 0.64/kg. Groupers nei (Epinephelus spp.) in Thailand costs US$ 12.56/kg compared to US$ 4.54/kg in Malaysia. Meanwhile, for threadfin breams nei (Nemipterus spp.), the producer price in Brunei Darussalam was US$ 10.37/kg compared to US$ 1.84/kg in Myanmar. Threadfins and tasselfishes nei (Polynemidae) in Singapore were US$ 15.55/kg compared to US$ 4.19/kg in Thailand. Likewise, for silver pomfret (Pampus argenteus), the producer price in Thailand was quite high at US$ 19.33/kg.
The producer price of the yellowfin tuna (Thunnus albacares) in Malaysia was highest at US$ 3.29/kg while the lowest was in Brunei Darussalam at US$ 1.41/kg. Scads nei (Decapterus spp.) in Singapore was priced at US$ 4.04/kg compared to Brunei Darussalam’s US$ 0.98/kg. For the yellowtail scad (Atule mate) the producer price in Brunei Darussalam was US$ 3.97/kg while the lowest price was US$ 1.68/kg in Malaysia.
For the blue swimming crab (Portunus pelagicus), the highest producer price was reported by Thailand at US$ 11.27/kg while the lowest was US$ 1.99/kg in Brunei Darussalam. For the giant tiger prawn (Penaeus monodon), the producer price in Brunei Darussalam was quite high at US$ 11.57/kg, while tropical spiny lobsters nei (Panulirus spp.) in Singapore was also quite high at US$ 19.39/kg. For common squids nei (Loligo spp.) in Singapore was US$ 5.23/kg compared to Brunei Darussalam’s US$ 1.55/kg. Cuttlefish and squids nei (Sepiidae) in Thailand was US$ 8.37/kg compared to US$ 4.88/kg in Singapore. As could be gleaned from the abovementioned information, the trends of the producer prices of the same commodities from among the countries in the region had generally wide variations.