 SEAFDEC Southeast Asian Fisheries Development Center
OVERVIEW OF THE FISHERIES SECTOR OF SOUTHEAST ASIA IN 2018
Fish and fishery products are becoming more increasingly important as primary sources of protein for many peoples in the world, most especially for those in the Southeast Asian region. During the past decade, the region’s production from capture fisheries and aquaculture had been considerably increasing, and recently, many Southeast Asian countries are among the highest producers of fish and fishery products in the world. This publication is therefore intended to provide the readers with glimpse of the increasing contribution of Southeast Asia’s fishery and aquaculture production to the world’s food fish basket. Based on the data and statistics provided by the Southeast Asian countries for the year 2018, the SEAFDEC Secretariat compiled and analyzed the necessary information for this publication. Of the 11 countries that comprise the Southeast Asian region, namely: Brunei Darussalam, Cambodia, Indonesia, Lao PDR, Malaysia, Myanmar, Philippines, Singapore, Timor-Leste, Thailand, and Viet Nam, only ten countries are covered in this publication as Timor-Leste has not yet been providing its fishery statistics and information to the SEAFDEC Secretariat.
Total Fishery Production of Southeast Asia
Table 1. Fishery production by continent from 2014 to 2018 (million MT)*
| 2014 | 2015 | 2016 | 2017 | 2018 | |
| World | 191.1 | 196.6 | 198.9 | 206.4 | 211.9 |
| Africa | 10.6 | 10.9 | 11.5 | 12.3 | 12.4 |
| America | 20.8 | 21.3 | 20.0 | 21.4 | 24.5 |
| Asia** | 99.2 | 101.5 | 103.5 | 107.5 | 108.5 |
| Southeast Asia*** | 42.1 | 44.0 | 45.3 | 45.5 | 46.5 |
| Europe | 16.9 | 17.3 | 16.9 | 18.1 | 18.4 |
| Oceania | 1.5 | 1.6 | 1.7 | 1.6 | 1.6 |
* Source (except for Southeast Asia): FAO FishStat Plus-Universal Software for Fishery Statistical Time Series
** Excludes Southeast Asia
*** Source: Fishery Statistical Bulletin of Southeast Asia (SEAFDEC, 2020)
As shown in Table 2, the fishery production of Southeast Asia from 2014 to 2018 exhibited a continuously increasing trend especially in terms of volume (quantity) although the increases in terms of value were quite unstable. The annual average increase in volume from 2014 to 2018 was 2.5 %, while the annual average rate of increase of the value was about 5.6 %. However, since some countries were not able to provide the value of their respective fishery production for 2018, such figures could be indicative only. Nevertheless, the figures still imply that in addition to the increasing volume, most of the fishery commodities harvested in the region were of high value. By country, Indonesia reported the highest fishery production in 2018 in terms of volume accounting for about 49.4 % of the total fishery production of Southeast Asia, followed by Viet Nam contributing about 16.7% and Myanmar at 12.6 %. The Philippines ranked next accounting for 9.9 %, Thailand at 5.3 %, Malaysia at 3.6 %, and Cambodia at 2.0 %. The contributions of Lao PDR, Brunei Darussalam and Singapore to the fishery production of Southeast Asia in 2018 were minimal in terms of volume.
In terms of value, Indonesia accounted for about 59.7 % of the total value of the region’s fishery production with Myanmar emerging second contributing about 13.7 %, and Thailand came in third contributing about 10.1 %. Meanwhile, the Philippines which ranked fourth in terms of volume and value, contributed about 9.4 %, and Malaysia which ranked fifth in terms of production volume as well as value accounted for 6.9 %. The trend of the fishery production of the Southeast Asian countries in 2014-2018 is shown in Fig. 1.
Table 2. Total fishery production of Southeast Asia by quantity and value (2014-2018)
| Fishery Production |
2014 | 2015 | 2016 | 2017 | 2018 |
| Quantity (MT) |
42,114,508 | 43,998,054 | 45,336,010 | 45,496,587 | 46,539,195 |
| Value (US$ 1,000) |
42,722,414* | 38,746,241** | 41,155,302* | 50,564,226* | 51,811,317* |
* Data not available from Cambodia and Viet Nam
** Data not available from Cambodia, Lao PDR and Viet Nam
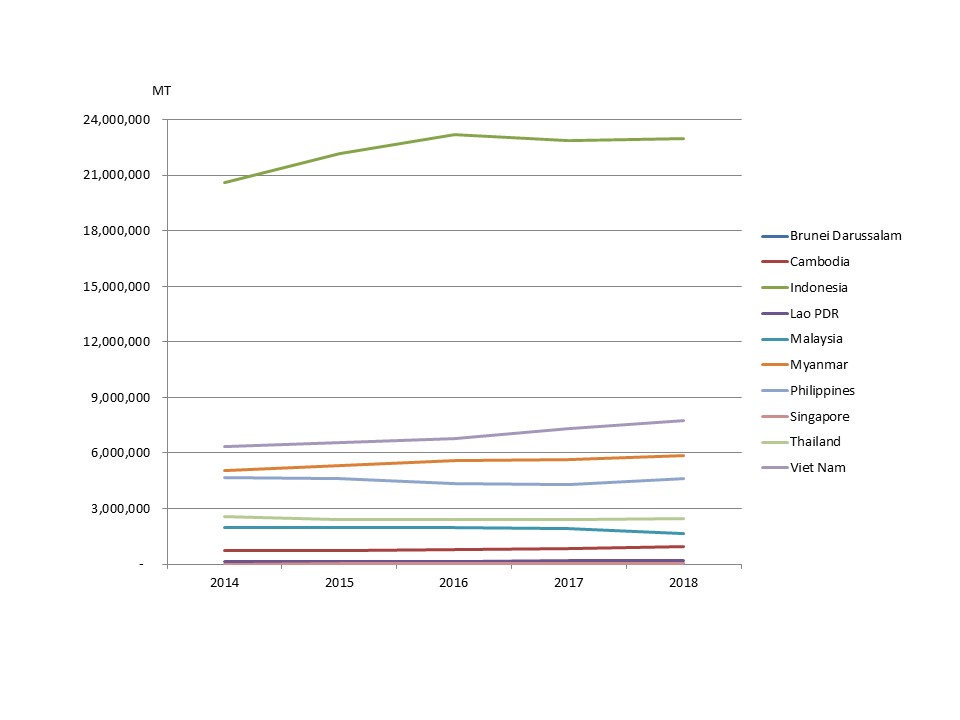
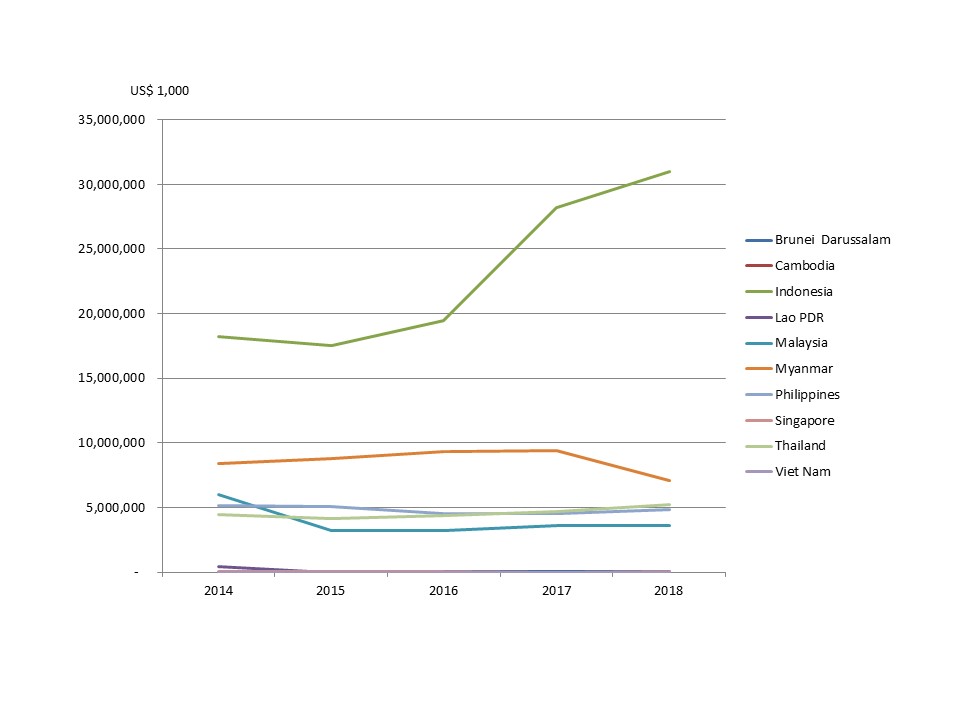
Fig. 1 Fishery production of the Southeast Asian countries in 2014-2018 (left in quantity; right in value)
The fishery production of Southeast Asia comes from three sub-sectors, namely: marine capture fisheries, inland capture fisheries, and aquaculture. By sub-sector, the total fishery production of the region in 2018 as shown in Table 3 indicated that the largest portion of the production volume was derived from aquaculture accounting for approximately 54 % followed by marine capture fisheries at about 39 % and inland capture fisheries at 7 %. In terms of production value, marine capture fisheries accounted for 54 %, aquaculture at 38 %, and inland capture fisheries at 8 % (Fig. 2). While the value per metric ton of marine capture fishery products was about US$ 1,534/MT, those from inland capture fisheries and aquaculture were about US$ 1,233/MT and US$ 787/MT, respectively. This implies that the global market had started to recognize the value of aquatic products harvested through inland capture fisheries, and had been patronizing such products lately.
Table 3. Fishery production (quantity and value) of Southeast Asia in 2018
| Sub-sector | Quantity (MT) |
Value* (US$ 1,000) |
Value/Quantity** (US$/MT) |
| Marine capture fisheries | 18,330,721 | 28,122,606 | 1,534 |
| Inland capture fisheries | 3,337,066 | 4,113.976 | 1,233 |
| Aquaculture | 24,871,804 | 19,574,735 | 787 |
| Total | 46,539,195 | 51,811,317 |
* Data not available from Cambodia, Lao PDR and Viet Nam
** Computation of price excludes corresponding quantity production from Cambodia, Lao PDR, and Viet Nam
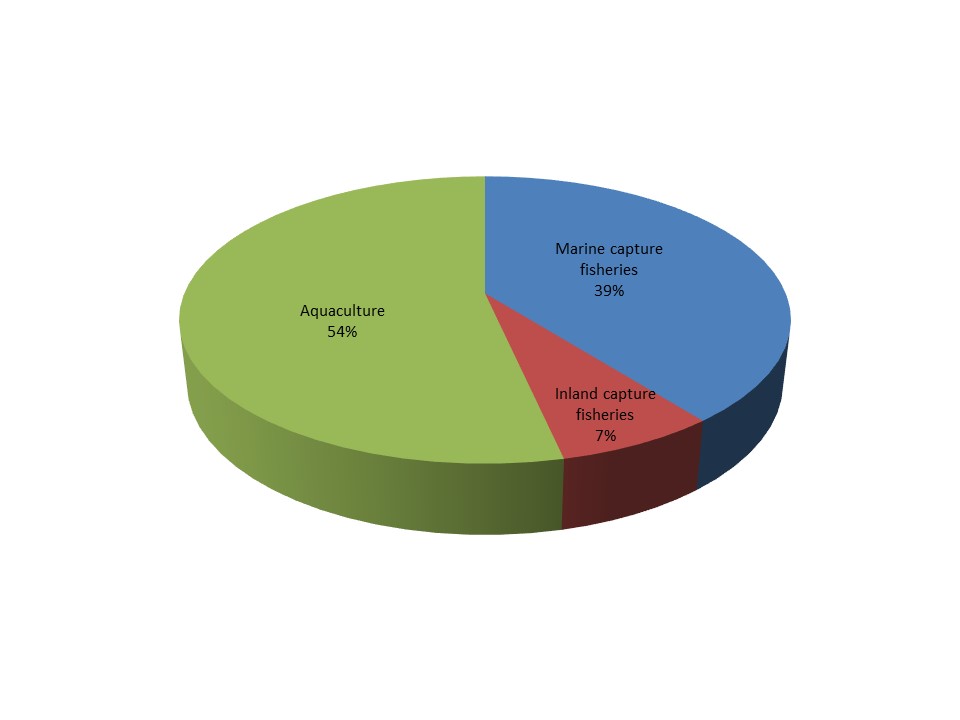
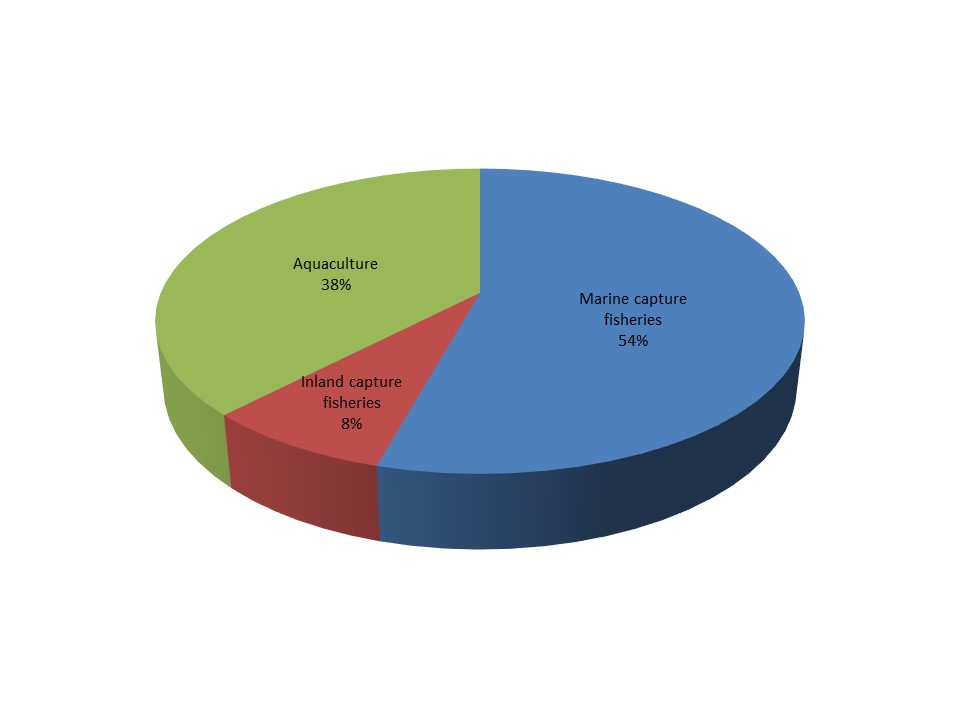
Fig. 2 Percentage of the sub-sectors’ contribution to Southeast Asia’s fishery production in 2018 (left in quantity; right in value)
Marine Capture Fishery Production of Southeast Asia
Table 4. Marine capture fishery production of Southeast Asia by quantity and value (2014-2018)
| Marine capture fishery production |
2014 | 2015 | 2016 | 2017 | 2018 |
| Quantity (MT) | 16,583,628 | 16,762,393 | 17,027,312 | 17,330,277 | 18,330,325 |
| Value (US$ 1,000) | 21,654,307* | 19,481,510* | 19,939,678* | 25,292,021* | 28,122,606* |
* Data not available from Cambodia and Viet Nam
In terms of quantity or volume, the total production from marine capture fisheries of the Southeast Asian countries during 2014-2018 indicated that Indonesia contributed the highest volume to the region’s total production. Specifically in 2018, Indonesia’s production was 6.62 million MT accounting for approximately 36.1 % of the region’s total, followed by Viet Nam at 3.4 million MT (18.5 %), Myanmar at 3.1 million MT (17.2 %), and Philippines at 2.1 million MT (11.7 %). Malaysia and Thailand had also produced considerable amount of aquatic commodities from marine capture fisheries at 1.4 million MT (7.9 %) and 1.4 million MT (7.6 %), respectively. A picture of the region’s production volume from marine capture fisheries in 2018 could be gleaned from Fig. 3.
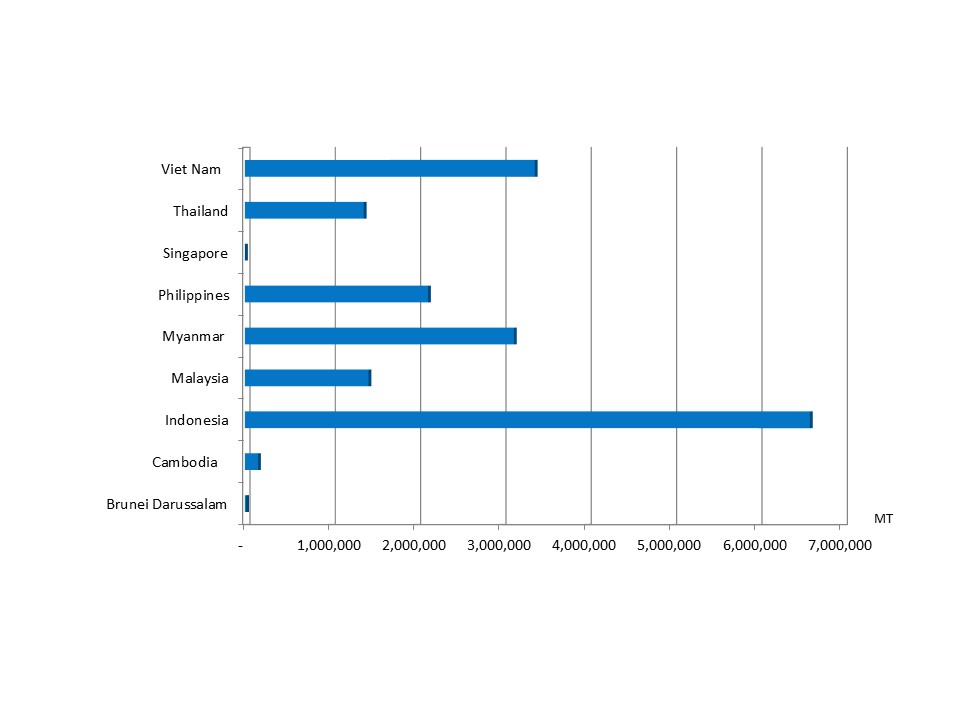
Fig. 3. Marine capture fishery production of Southeast Asia in 2018
Although some Southeast Asian countries were not able to provide the value of their production from marine capture fisheries, the trend of the total value of the region’s marine capture fishery production from 2014 to 2018 seemed to have increased corresponding to the increasing trend of the region’s production volume. By country, Indonesia which led the Southeast Asian countries, accounted for about 62.7 % of the region’s marine capture fishery production value in 2018, with Myanmar emerging second contributing about 11.2 %. Meanwhile, Malaysia which came in third in terms of value contributed about 9.9 %, the Philippines came in fourth at 9.2%, and lastly, Thailand contributed about 6.8 %.
Disaggregating the 2018 production volume from marine capture fisheries by major commodity groups, marine fishes provided the highest volume (Table 5) accounting for about 87.1 % followed by crustaceans at 4.2 % while the mollusks, invertebrates and seaweeds contributed 3.1 %, 0.6 %, and 0.2 %, respectively. It should be noted that 4.7 % was contributed by other commodity groups which could not be appropriately classified as some countries were not able to provide their respective production volume by species. In 2018, the production volume of mollusks and seaweeds had decreased from that of 2017 by about 32.0 % and 6.1 %, respectively, but the production volume of marine fishes, crustaceans, invertebrates, and others had increased by about 7.4 %, 6.5 %, 22.2 % and 14.1 %, respectively, compared with the corresponding volume in 2016.
Table 5. Production of the major commodity groups from marine capture fishery in Southeast Asia (in MT)
| Commodity Group | 2014 | 2015 | 2016 | 2017 | 2018 |
| Marine fishes | 14,553,024 | 14,310,200 | 14,726,719 | 14,880,726 | 15,974,939 |
| Crustaceans | 627,640 | 636,342 | 708,248 | 718,355 | 765,095 |
| Mollusks | 548,348 | 532,192 | 540,958 | 830,724 | 564,974 |
| Seaweed | … | 78,230 | 41,457 | 47,271 | 44,383 |
| Invertebrates | 118,016 | 2,609 | 105,886 | 92,901 | 113,482 |
| Others | 736,600 | 1,202,820 | 904,044 | 760,300 | 867,452 |
| Total marine capture fishery production (MT) |
16,583,628 | 16,762,393 | 17,027,312 | 17,330,277 | 18,330,325 |
Comparing the volume of the total fishery production in 2018 with that of 2017, an increase in production of the marine fishes is obvious, which could have been influenced by various factors that include: Indonesia’s increased production of various major commodities such as frigate tuna (Auxis thazard) from fishing area 571 and 712 , as well as kawakawa (Euthynnus affinis), yellowfin tuna (Thunnus albacares), Indo-Pacific king mackerel (Scomberomorus guttatus), and production of crustaceans; the Philippines’s production of major marine fishes that also increased considerably, especially skipjack tuna (Katsuwonus pelamis), and scads nei (Decapterus spp.) from fishing area 71; and Thailand’s increased production of Engraulidae from fishing area 57 and 71.
Moreover, the region’s production of major species such as the Thunnus alalunga (Albacore) decreased in 2018 compared with that of 2017 which could have been influenced by the reduced production of Indonesia and Malaysia; Rastrelliger spp. production also decreased in 2018 compared with that of 2017 which could have been influenced by decreased production of Malaysia and Thailand. Meanwhile, production of Metapenaeus spp. (Metapenaeus shrimps nei) in 2018 had increased compared with that of 2017, which could have been brought about by Indonesia’s increased production from fishing areas 57 and 71.
The economically-important marine species that provided sizeable contribution to the total fishery production of Southeast Asia from marine capture fisheries (by quantity and value) in 2018 are shown in Table 6. The data indicate that miscellaneous marine fishes (unidentified) contributed the highest volume at about 42.59% and value at about 19.40%. Production from the tunas group contributed about 11.32% to the total production quantity and ranked the second highest, although it was ranked the highest in terms of value accounting for about 14.57% of the total production value.
The data in Table 6 also suggest that the production value of Indo-Pacific king mackerel is valued the highest among the commodities harvested through marine capture fisheries at US$ 7,200/MT followed by Stolephorus spp. (Stolephorus anchovies) at US$ 4,872/MT, then crustaceans group, at US$ 4,773/MT, Scomberomorus spp. (seerfishes nei) at US$ 4,708/MT, Thunnus obesus (bigeye tuna) at US$ 3,137/MT, Rastrelliger brachysoma (short mackerel) at US$ 3,079/MT, Thunnus maccoyii (Southern bluefin tuna) at US$ 2,921/MT, Thunnus alalunga (albacore tuna) at US$ 2,884/MT, mollusks group at US$ 2,643/MT, Rastrelliger kanagurta (Indian mackerel) at US$ 2,423/MT, Rastrelliger spp. (Indian mackerels nei) at US$ 2,415/MT, Thunnus albacores (yellowfin tuna) at US$ 2,269/MT, Megalaspis cordyla (torpedo scad) at US$ 1,617/MT, Euthynnus affinis (kawakawa) at US$ 1,608/MT, Katsuwonus pelamis (skipjack tuna) at US$ 1,590/MT, Selaroides leptolepis (yellowstripe scad) at US$ 1,584/MT, Thunnus tonggol (longtail tuna) at US$ 1,556/MT, and Selar crumenophthalmus (bigeye scad) at US$ 1,532/MT. The average price of miscellaneous marine fishes (unidentified) which contributed the highest volume in 2018 was estimated at US$ 1,081/MT, implying that this group must have generated low-value fishes that possibly include trash fishes.
Table 6. Economically-important marine species caught in the region in 2018
| Group/species | Quantity (MT) |
Percentage of total quantity of marine capture fishery production (%) |
Value (US$1,000)* |
Percentage of total value of marine capture fishery production (%) |
Prices (US$/MT)** |
| Tunas Neritic tunas Frigate tuna Bullet tuna Kawakawa Longtail tuna Narrow-barred Spanish mackerel Indo-Pacific king mackerel Seerfihes Oceanic tunas Skipjack tuna Albacore tuna Southern bluefin tuna Yellowfin tuna Bigeye tuna |
2,075,418 968,247 296,789 28,984 296,004 126,197 164,888 25,415 29,970 1,107,171 720,356 5,811 648 293,755 86,601 |
11.32 |
4,096,571 1,669,855 410,587 39,886 476,029 196,400 222,861 182,990 141,102 2,426,716 1,145,597 16,761 1,893 666,666 271,707 |
14.57 |
1,974 1,725 1,383 1,376 1,608 1,556 1,351 7,200 4,708 2,192 1,590 2,884 2,921 2,269 3,137 |
| Scads Bigeye scad Yellowstripe scad Torpedo scad Indian scad Other scads |
788,752 206,720 105,827 99,239 140,654 236,132 |
4.30
|
1,130,807 316,767 167,607 160,519 176,200 309,714 |
4.02 | 1,434 1,532 1,584 1,617 1,253 1,312 |
| Mackerels Spotted chub mackerel Short mackerel Indian mackerel Indian mackerels nei Mackerels nei |
695,588 3,111 336,176 196,191 67,589 92,521 |
3.74
|
1,690,767 2,146 1,035,082 266,350 163,752 223,437 |
6.01
|
2,431 690 3,079 1,358 2,423 2,415 |
| Anchovies Stolephorus anchovies Other anchovies |
410,811 279,920 130,891 |
2.24 | 1,454,759 1,363,803 90,956 |
5.17
|
3,541 4,872 695 |
| Sardines Spotted sardinella Goldstripe sardinella Bali sardinella Rainbow sardines Sardinellas nei |
1,016,470 43,514 201,635 302,305 46,723 422,293 |
5.54 | 856,536 51,284 227,964 285,550 55,395 236,343 |
3.05 | 843 1,179 1,131 945 1,186 560 |
| Crustaceans | 765,095 | 4.17 | 3,568,145 | 12.69 | 4,773 |
| Mollusks | 564,974 | 3.08 | 1,453,213 | 5.17 | 2,643 |
| Marine fishes unidentified |
7,806,209 | 42.59 | 5,456,392 | 19.40 | 1,081 |
* Data not available from Cambodia and Viet Nam
** Computation of price excludes corresponding quantity production from Cambodia and Viet Nam
The data in Table 6 also suggest that the production price (value/quantity) of seerfishes group is valued the highest among the commodities harvested through marine capture fisheries at US$ 3,711/MT followed by crustaceans group at US$ 3,576/MT, then bigeye tuna (Thunnus obesus) at US$ 3,039/MT; molluscs group at US$ 2,953/MT; albacore tuna (Thunnus alalunga) at US$ 2,713/MT; yellowfin tuna (Thunnus albacares) at US$ 2,192/MT; longtail tuna (Thunnus tonggol) at US$ 1,614/MT; yellowstripe scad (Selaroides leptolepis) at US$ 1,535/MT; Stolephorus anchovies nei (Stolephorus spp.) at US$ 1,469/MT; miscellaneous marine fishes (unidentified) at US$ 1,465/MT; kawakawa (Euthynnus affinis) at US$ 1,383/MT; frigate tuna (Auxis thazard), at US$ 1,379/MT; skipjack tuna (Katsuwonus pelamis) at US$ 1,299/MT; scads group at US$ 1,252MT; bigeye scad (Selar crumenophthalmus) at US$ 1,248/MT; Torpedo scad (Megalaspis cordyla) at US$ 1,223/MT; Indian mackerels group at US$ 760/MT; and other anchovies at US$ 491/MT.
Inland Capture Fishery Production of Southeast Asia
While the Southeast Asian countries reported their respective data on production from inland capture fisheries during 2014-2018, only five countries reported the corresponding production values. Thus, the actual regional production trend of the inland capture fisheries sub-sector could not be established. At any rate, as the consistent top producer, Myanmar maintains a stable inland fishery production from 2014 to 2018 that accounted for 33.6 % of the country’s total production from capture fisheries, 27.1 % of the country’s total fishery production, and 3.4 % of the region’s total fishery production (Table 7).
Table 7. Contribution of Southeast Asian countries’ inland capture fisheries to the region’s total fishery production in 2018
| Country | Inland capture production (MT) |
Total capture production (MT) |
% of inland capture production to total capture production |
Total fishery production (MT) |
% of inland capture fishery production to total fishery production |
| Brunei Darussalam |
… | 13,566 | … | 14,712 | … |
| Cambodia | 535,555 | 689,155 | 77.7 | 943,205 | 56.8 |
| Indonesia | 612,753 | 7,238,120 | 8.5 | 23,007,392 | 2.7 |
| Lao PDR | 70,900 | 70,900 | 100 | 179,100 | 39.6 |
| Malaysia | 6,089 | 1,455,066 | 0.4 | 1,672,447 | 0.4 |
| Myanmar | 1,594,970 | 4,747,110 | 33.6 | 5,877,460 | 27.1 |
| Philippines | 162,974 | 2,308,709 | 7.1 | 4,613,074 | 3.5 |
| Singapore | … | 1,309 | … | 7,011 | … |
| Thailand | 143,825 | 1,536,756 | 9.4 | 2,456,294 | 5.9 |
| Viet Nam | 210,000 | 3,606,700 | 5.8 | 7,768,500 | 2.7 |
| Total | 3,337,066 | 21,667,391 | 15.4 | 46,539,195 | 7.2 |
The second highest producer, Indonesia reported a production volume of 612,753 MT in 2018 that represented 8.5% of the country’s production from capture fisheries, 2.7 % of the country’s total fishery production, and 1.3 % of the region’s total fishery production.
It should be noted however that such production volumes could not be confirmed as accurate considering that most of the countries still need to improve their systems of collecting and compiling their respective fishery statistics, especially with regards to their production from inland capture fisheries.
Only three countries, namely: Indonesia, Philippines, and Thailand, had provided their respective production data from inland capture fisheries by species, while the other countries were not able to report due to inadequacy of expertise in identifying the catch by species. Capacity building in this aspect is therefore necessary to enable the countries to compile their respective inland fishery production by major groups of species. Thus, production from inland capture fisheries of Cambodia, Lao PDR, Malaysia, Myanmar, and Viet Nam in 2018 could not be analyzed in terms of species because these countries were not able to provide the breakdown of their production volume by species. Nonetheless, the production of Indonesia as the region’s second highest producer was made up mainly of the striped snakehead (Channa striata) which accounted for about 10.6 % of the country’s total production from inland capture fisheries.
Next to miscellaneous fishes which provided the highest production from inland capture fisheries accounting for 70.2 % of the region’s total inland fishery production in 2018 (Table 8), production of striped snakehead (Channa striata) was the second highest at 2.6 % followed by Nile tilapia (Oreochromis niloticus) at 2.1%, Asian redtail catfish (Hemibagrus nemurus) at 1.8 %, and silver barb (Barbonymus gonionotus) at 1.5%. Production value per volume of the Asian redtail catfish (Hemibagrus nemurus) is valued the highest among the commodities harvested through inland capture fisheries at US$ 2,462/MT followed by the striped snakehead (Channa striata) at US$ 2,356/MT, Pangasius djambal at US$ 1,858/MT, and Nile tilapia (Oreochromis niloticus) at US$ 1,697/MT.
Table 8. Production of major inland fisheries species in Southeast Asia in 2018
| Common name | Quantity (MT) |
Percentage total quantity of major inland species to total inland capture production (%) |
Value (US$ 1,000)* |
Percentage total value of major inland species to total inland capture production (%) |
Price (US$/MT)** |
| Misc. fishes | 2,343,702 | 70.2 | 2,697,904 | 65.6 | 1,552 |
| Striped snakehead |
86,664 | 2.6 | 204,143 | 5.0 | 2,356 |
| Nile tilapia | 70,291 | 2.1 | 119,284 | 2.9 | 1,697 |
| Asian redtail catfish | 60,957 | 1.8 | 150,067 | 3.6 | 2,462 |
| Silver barb | 50,988 | 1.5 | 76,200 | 1.8 | 1,494 |
| Freshwater mollusks nei | 50,917 | 1.5 | 8,722 | 0.2 | 171 |
| Snakeskin gourami | 44,804 | 1.3 | 62,786 | 1.5 | 1,401 |
| Tilapias nei | 44,071 | 1.3 | 51,490 | 1.2 | 1,168 |
| Climbing perch | 43,462 | 1.3 | 72,134 | 1.7 | 1,660 |
| Torpedo-shaped catfishes nei |
33,910 | 1.0 | 55,478 | 1.3 | 1,636 |
| Glass catfishs | 29,873 | 0.9 | 20,938 | 0.5 | 701 |
| Pangasius djambal | 29,057 | 0.9 | 53,985 | 1.3 | 1,858 |
* Data not available from Cambodia, Lao PDR, and Viet Nam
** Computation of price excludes corresponding quantity production from Cambodia, Lao PDR, and Viet Nam
Aquaculture Production of Southeast Asia
The production of spiny eucheuma (Eucheuma denticulatum) of Indonesia as the largest producer of aquaculture products in 2018, contributed 60.6 % to the production volume and 11.0 % to the production value, of the country’s aquaculture production. This was followed by Gracilaria seaweeds (Gracilaria spp.) accounting for 8.5 %, Nile tilapia (Oreochromis niloticus) at 6.6 %, and torpedo-shaped catfishes (Clarias spp.) at 4.8 %. In the case of Viet Nam, as the second highest producer from aquaculture, 69.8 % of its aquaculture production came from freshwater fishes nei (Osteichthyes) followed by freshwater prawns nei which accounted for 19.4 % of the country’s aquaculture production.
For the Philippines as the third highest producer from aquaculture, its main aquaculture product is the elkhorn sea moss (Kappaphycus alvarezii) contributing 61.0 % to the country’s production from aquaculture followed by milkfish (Chanos chanos) accounting for 15.1 %, Nile tilapia (Oreochromis niloticus) at 7.3 %, and tilpia nei (Oreochromis(=Tilapia) spp.) at 3.9 %. For Myanmar, its main production from aquaculture is roho labeo (Labeo rohita) which accounted for 48.6 % of the country’s production from aquaculture followed by silver barb (Barbonymus gonionotus) accounting for 20.5 %, common carp (Cyprinus carpio) accounting for 10.7 %, and tilapias nei (Oreochromis(=Tilapia) spp.) at 3.9 %. Thailand’s main aquaculture product, which is the whiteleg shrimp (Penaeus vannamei), accounted for 38.9 % of the country’s production from aquaculture followed by Nile tilapia (Oreochromis niloticus) at 23.6 %, hybrid catfishes (C. gariepinusx C. macrophalus) at 11.5 %, and Barramundi (Lates calcarifer) at 4.3 %.
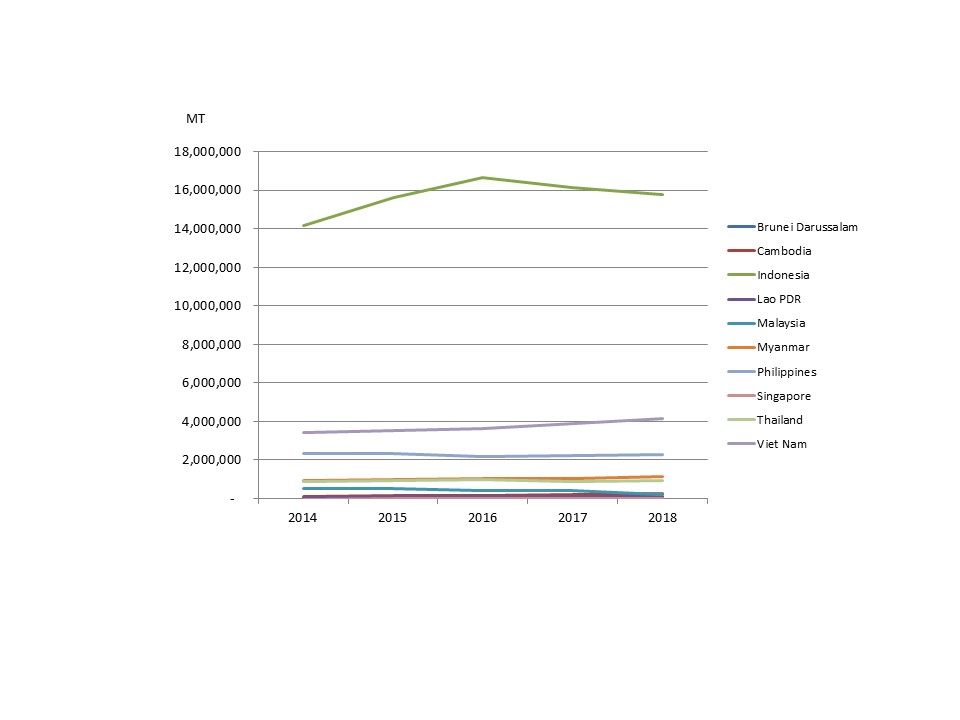
Fig. 4. Trend of the aquaculture production (MT) of the Southeast Asian countries from 2014 to 2018
In terms of value per volume of aquaculture production in 2018, Singapore attained the highest average value at US$ 7,818/MT followed by Brunei Darussalam at US$ 7,433/MT, Malaysia at US$ 3,509/MT, Thailand at US$ 3,2282MT, Myanmar at US$ 1,326/MT, Philippines at US$ 904/MT, and Indonesia at US$ 771/MT. Meanwhile, the value per metric ton of aquaculture production of Cambodia, Lao PDR, and Viet Nam in 2018 could not be calculated as their respective total production values were not reported.
Aquaculture production comes from three environments, namely: marine, brackishwater, and freshwater. In terms of volume, aquaculture in marine areas or mariculture provided 47.0 % to the region’s total aquaculture production in 2018 while brackishwater aquaculture contributed 16.0 %, and the remaining 37.0 % came from freshwater aquaculture (Fig. 5). In terms of value, however, brackishwater aquaculture production value contributed the highest at 44.0 % followed by those of the freshwater aquaculture production at 41.0 % and mariculture production at 15.0 %.
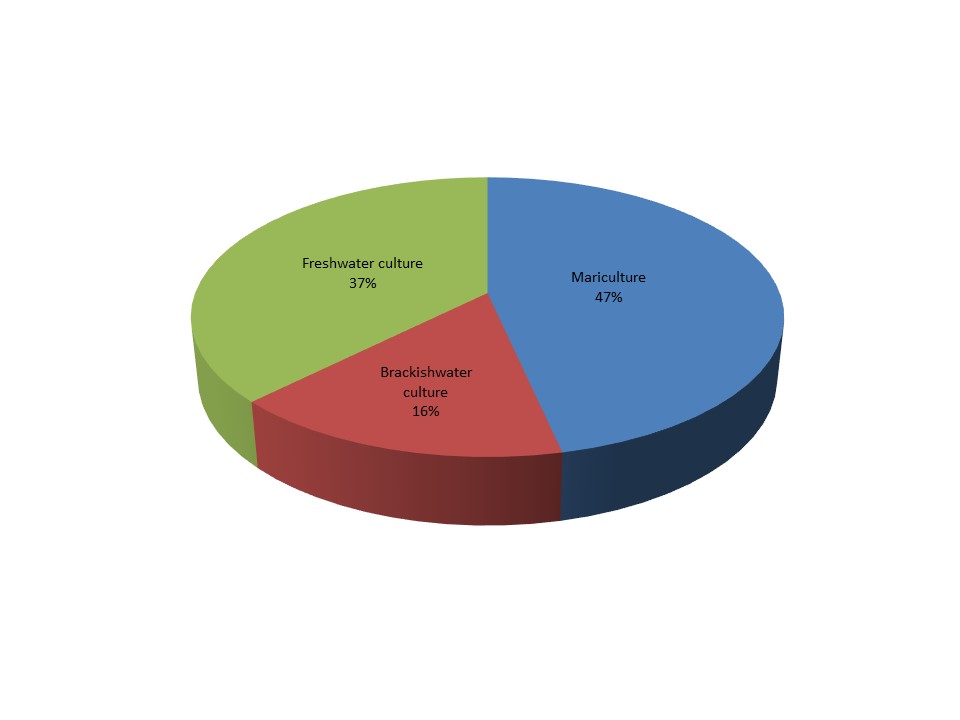
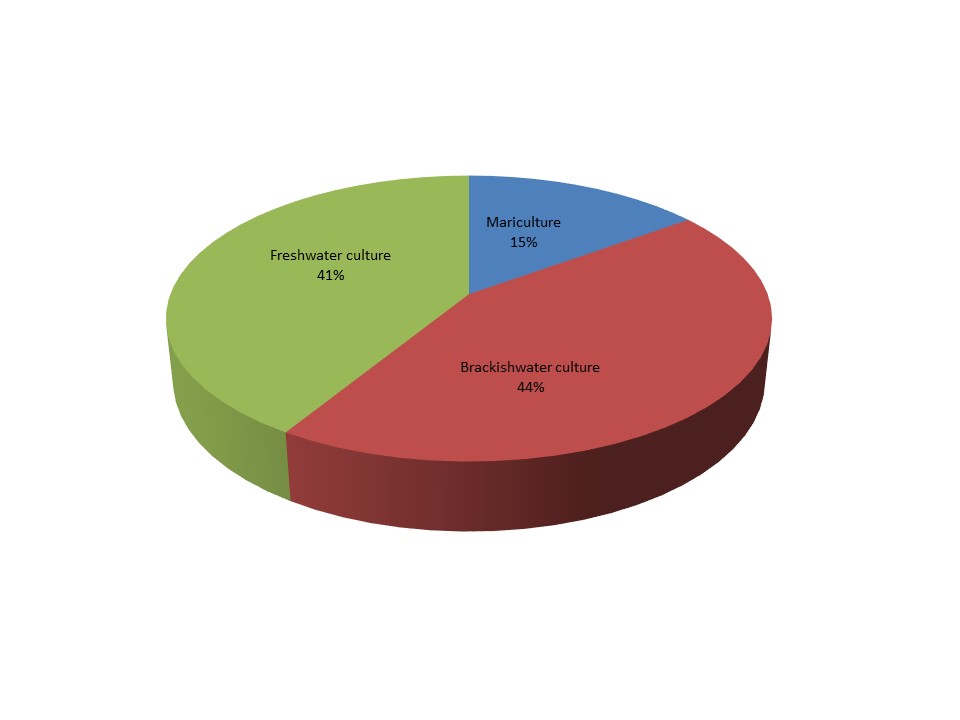
Fig. 5 Percentage of aquaculture production by sub-sector in 2018 (left by quantity: right by value)
It should be recalled that in 2017, production in terms of volume from mariculture accounted for 47.0 % of the total aquaculture production, while brackishwater culture production accounted for 15.0 % and freshwater culture production at 38.0 %. In terms of value, mariculture contributed 14.0 % to the region’s total aquaculture production value, brackishwater aquaculture production at 44.0 %, and freshwater aquaculture production at 42.0 %. In 2018, the production value from brackishwater aquaculture slightly increased by 5.7 % from that of 2017 which could be due to the increased production of Gracilaria seaweeds (Gracilaria spp.) by Indonesia. Meanwhile, production from freshwater aquaculture in 2018 slightly decreased by 1.7 % compared with that of 2017, which could be due to the decreasing value of the production of Brunei Darussalam, Cambodia, Indonesia, Lao PDR, Malaysia, and Singapore. As a result, the region’s production value from freshwater aquaculture also slighly decreased by 1.0 %.
Mariculture
In 2018, the region’s total production in terms of volume from mariculture contributed about 47.0 % to the region’s total production and 15.0 % in terms of value. Farmed aquatic plants, such as the spiny eucheuma (Eucheuma denticulatum) and the elkhorn sea moss (Kappaphycus alvarezii), contributed 95.1 % to the region’s total mariculture production volume. Indonesia’s production of the spiny eucheuma (Eucheuma denticulatum) accounted for about 83.0 % of the region’s total production volume from mariculture, followed by the elkhorn sea moss (Kappaphycus alvarezii) the main mariculture product of the Philippines which accounted for 12.1 % to the region’s mariculture production. Moreover, milkfish (Chanos chanos) which is mainly produced by the Philippines, contributed 1.0 %, green mussels (Perna viridis) mainly produced by Thailand at 0.5 %, blood cockle (Anadara granosa) mainly produced by Malaysia and Thailand at 0.4 %, oysters group mainly produced by Thailand at 0.4 %, and shrimps mainly produced by Myanmar at 0.2 % (Fig. 6).
In terms of value, the spiny eucheuma (Eucheuma denticulatum) contributed 45.9 % to the region’s total mariculture production value followed by milkfish (Chanos chanos) which contributed about 8.7 %, elkhorn sea moss at 6.8 %, blood cockle at 5.5 %, and shrimps that accounted for 5.2 % (Fig. 6). Moreover, shrimps earned the highest value per volume at US$ 8,000/MT followed blood cockle at US$ 3,421/MT, and milkfish at US$ 2,131/MT. Meanwhile, the lowest value was obtained for the spiny eucheuma at US$ 140/MT (Table 9).
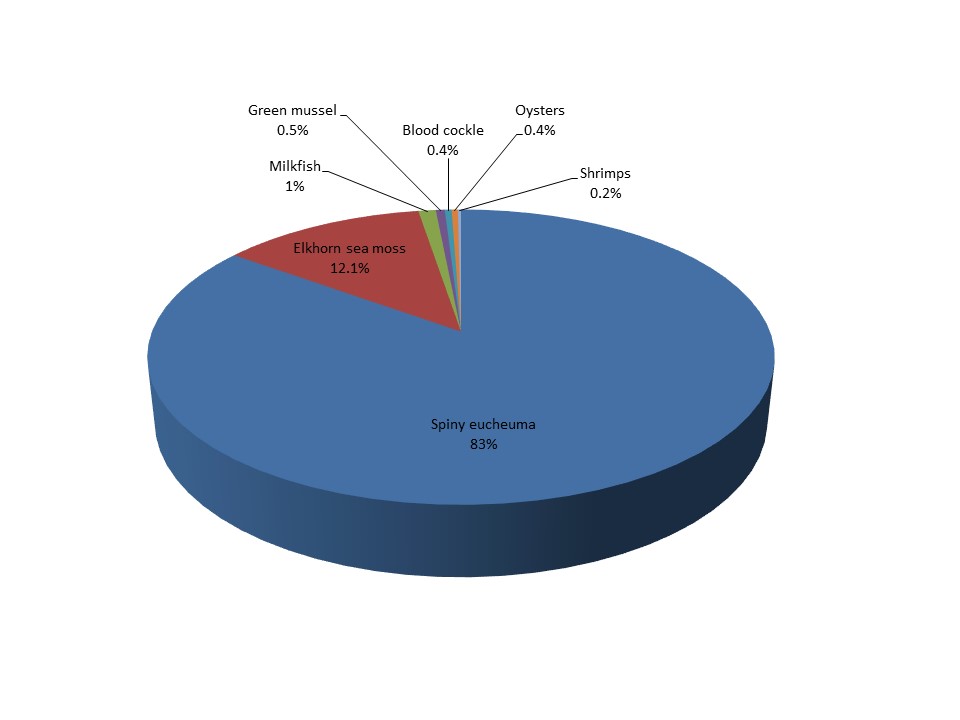
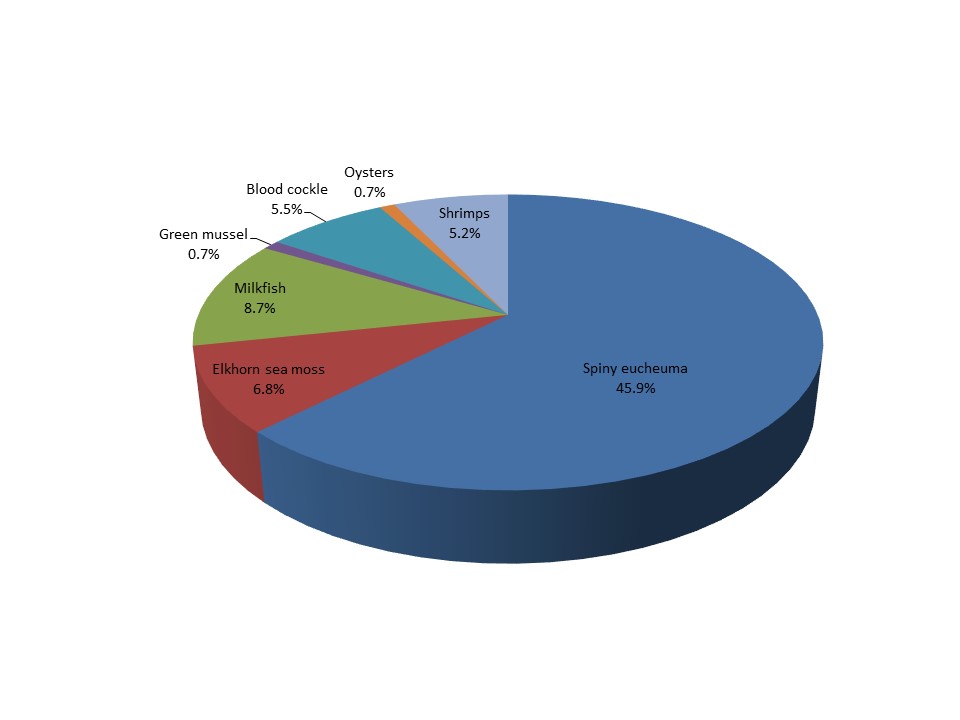
Fig. 6 Mariculture production in 2018 by major species (left by quantity; right by value)
Table 9. Major mariculture species produced in the region (as of 2018)
| Common name | Quantity (MT) |
Percentage production of major commodities from mariculture to total mariculture production (%) |
Value (US$ 1,000) |
Percentage total value of major commodities production from mariculture to total mariculture value (%) |
Price (US$/MT) |
| Spiny eucheuma | 9,622,326 | 83.0 | 1,345,246 | 45.9 | 140 |
| Elkhorn sea moss | 1,405,413 | 12.1 | 200,158 | 6.8 | 142 |
| Milkfish | 120,127 | 1.0 | 255,955 | 8.7 | 2,131 |
| Green mussel | 61,684 | 0.5 | 21,726 | 0.7 | 352 |
| Blood cockle | 47,022 | 0.4 | 160,841 | 5.5 | 3,421 |
| Oysters | 43,214 | 0.4 | 20,091 | 0.7 | 465 |
| Shrimps | 19,042 | 0.2 | 152,335 | 5.2 | 8,000 |
As for value per volume of mariculture production in 2018, Brunei Darussalam posted the highest at an average of US$ 8,361/MT from its production of the highly economical species of groupers nei (Epinephelus spp.), followed by Myanmar at US$ 7,925/MT for shrimps, and Singapore at US$ 7,435/MT for its production of the mud spiny lobster (Panulirus polyphagus). Meanwhile, the mariculture production value per volume of Thailand was at US$ 2,080/MT, Malaysia at US$ 1,351/MT, Philippines at US$ 708/MT, and Indonesia at US$ 148/MT.
Brackishwater Culture
The total production from brackishwater aquaculture in 2018 represented about 16 % of the region’s total production from aquaculture (Fig. 7). Production of Gracilaria seaweeds (Gracilaria spp.) mainly produced by Indonesia had the highest volume representing 33.7 % of the region’s total production from brackishwater aquaculture. The second highest was contributed by milkfish (Chanos chanos) at 17.7 % mainly produced by Indonesia and the Philippines, and the third came from whiteleg shrimps (Penaeus vannamei) at 22.1 % mainly produced by Indonesia, Thailand, and Malaysia. Meanwhile, the giant tiger prawn (Penaeus monodon) contributed 5.0 % mainly from Indonesia; the group of fishes provided 2.1 %, shrimps at 1.7 %, and giant sea perch (Lates calcarifer) at 1.2 % mainly contributed by Thailand. In terms of value, the whiteleg shrimp (Penaeus vannamei) had the highest, which was provided by Indonesia, Malaysia, and Thailand, contributing 48.4 %; followed milkfish (Chanos chanos) from Indonesia and the Philippines at 25.5 %; giant tiger prawn (Penaeus monodon) from Malaysia Indonesia, Philippines and Thailand contributing 14.7 %; fishes at 5.7 %; giant sea perch (Lates calcarifer) from Thailand, Malaysia, and Indonesia at 3.5 %; shrimps at 1.9 %; and Gracilaria seaweeds (Gracilaria spp.) from Indonesia at 1.6 %.
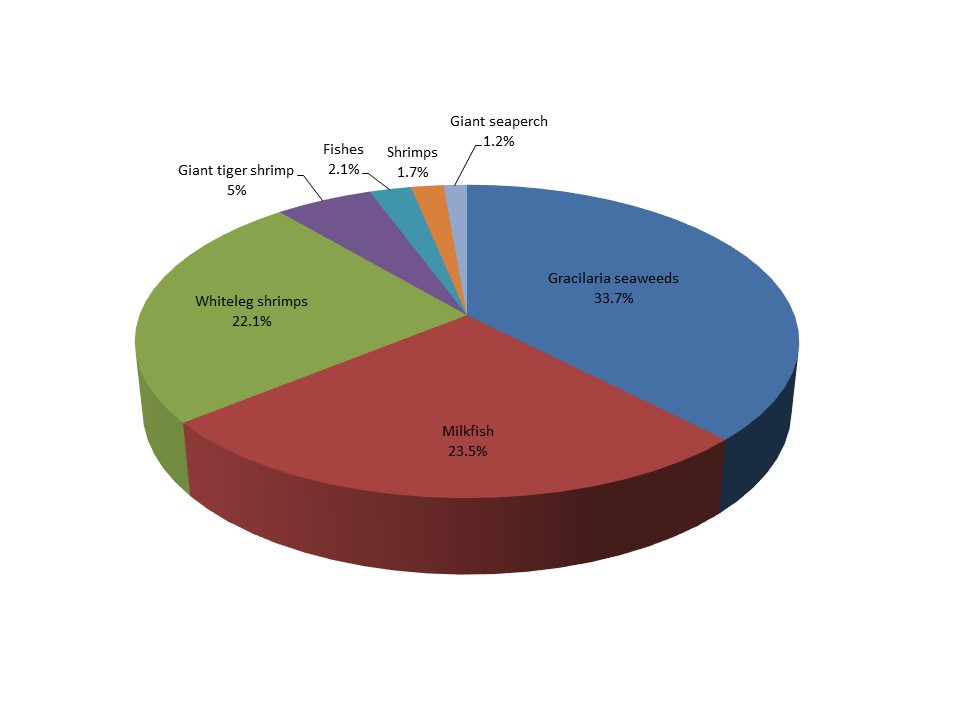
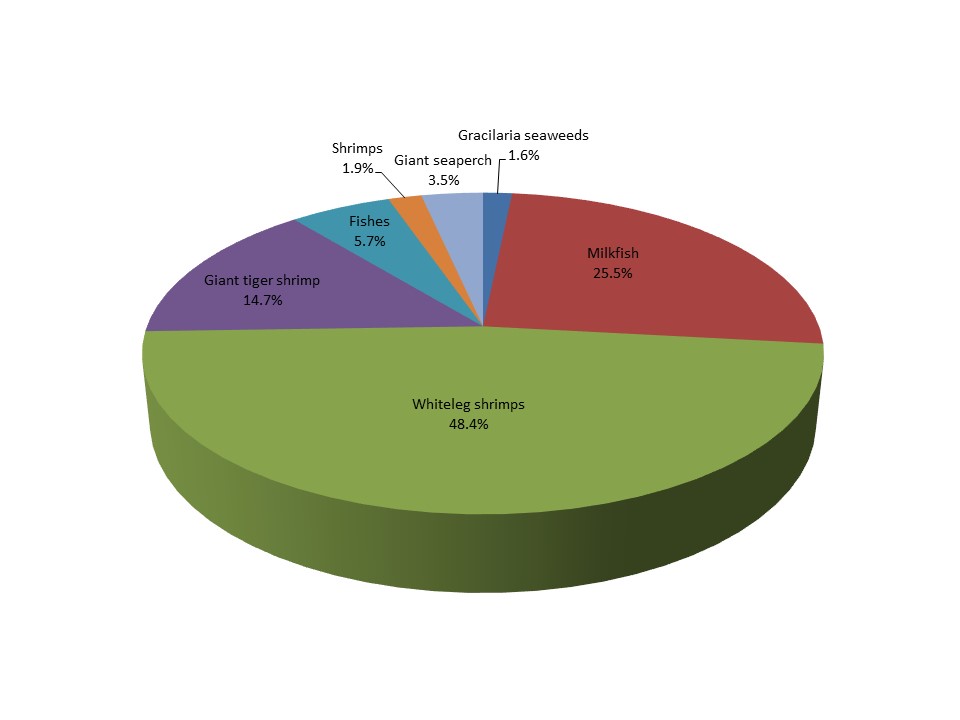
Fig. 7 Brackishwater culture production in 2018 by species (left by quantity; right by value)
In terms of average value per volume of production from brackishwater culture, considering only the countries that reported their respective production values, Singapore posted the highest at US$ 9,004/MT followed by Brunei Darussalam at US$ 6,983/MT, Malaysia at US$ 5,329/MT, Thailand at US$ 4,920/MT, Indonesia at US$ 1,834/MT, and the Philippines at US$ 1,190/MT. Cambodia and Viet Nam did not report their respective production value from brackishwater aquaculture. The highest value per metric ton of production was attained by the giant tiger shrimp at US$ 6,396/MT followed by giant sea perch at US$ 6,354/MT, fishes at US$ 5,821/MT, whiteleg shrimps at US$ 4,744/MT, shrimps at US$ 2,445/MT, milkfish at US$ 2,343/MT, and Gracilaria seaweeds which obtained the lowest value at US$ 105/MT (Table 10).
Table 10. Major brackishwater species cultured in the region (as of 2018)
| Common name | Quantity (MT) |
Percentage brackishwater culture production of major commodities to total brackishwater culture production (%) |
Value (US$ 1,000)* |
Percentage total value of major commodities production from brackishwater culture to total brackishwater culture value (%) |
Price (US$/MT)** |
| Gracilaria seaweeds | 1,338,716 | 33.7 | 140,842 | 1.6 | 105 |
| Milkfish | 932,505 | 23.5 | 2,184,948 | 25.5 | 2,343 |
| Whiteleg shrimps | 875,997 | 22.1 | 4,156,209 | 48.4 | 4,744 |
| Giant tiger shrimp | 197,641 | 5.0 | 1,264,154 | 14.7 | 6,396 |
| Misc. fishes | 84,587 | 2.1 | 492,413 | 5.7 | 5,821 |
| Shrimps | 66,303 | 1.7 | 162,088 | 1.9 | 2,445 |
| Giant seaperch | 47,053 | 1.2 | 298,986 | 3.5 | 6,354 |
* Data not available from Cambodia and Viet Nam
** Computation of price excludes corresponding quantity production from Cambodia and Viet Nam
Freshwater Culture
The region’s total production from freshwater culture in 2018 accounted for about 37.0 % of the region’s total production from aquaculture, a slight decrease of about 1.7% from that of the 2017 production volume. In 2017, Viet Nam was the highest producer from freshwater aquaculture contributing about 41.2 % of the region’s total production from freshwater culture, followed by Indonesia at 34.0 %, Myanmar at 11.9 %, Thailand at 4.6 %, Philippines at 3.5 %, Cambodia at 2.6 %, Lao PDR at 1.2 %, and Malaysia at 1.1 %.
Having accounted for 41.0 % of the region’s total aquaculture production value in 2018, the freshwater culture sub-sector had emerged as a very important fisheries sub-sector, notwithstanding the decrease of its production value by almost 10.3 % in 2018 compared with that of 2017. This information however, should not be underestimated considering that the corresponding production values from Cambodia, Lao PDR, and Viet Nam had not yet been reported.
In terms of production volume from freshwater culture by species (Fig 8), miscellaneous freshwater fishes accounted for 35.9 % of the region’s total production from freshwater culture, which was mainly contributed by Viet Nam. This was followed by Nile tilapia (Oreochromis niloticus) which accounted for 15.4 % and contributed mainly by Indonesia, Thailand, and the Philippines, and the freshwater prawns nei followed at 8.7 % which was contributed mainly by Viet Nam, torpedo-shaped catfish (Clarias spp.) came in next at 8.5 % contributed mainly by Indonesia, common carp (Cyprinus carpio) at 6.6 % contributed mainly by Indonesia, and Myanmar, roho labeo (Labeo rohita) at 6.0% contributed mainly by Myanmar, pangas catfishes nei (Pangasius spp.) contributed mainly by Indonesia at 4.5 %, silver barb (Barbonymus gonionotus) accounted for 3.0 % contributed by Myanmar, tilapia nei (Oreochromis (=Tilapia) spp.) at 1.7 % contributed mainly by the Philippines, Myanmar, and Malaysia, and giant gourami (Osphronemus goramy) at 1.4 % mainly contributed by Indonesia.
On production value, the highest contributor to the region’s total production value from freshwater culture in 2018 was Nile tilapia (Oreochromis niloticus) which accounted for 26.9 % of the region’s total production from freshwater culture, followed by torpedo-shaped catfishes (13.8 %), common carp (12.7 %), roho labeo (8.4 %), pangas catfishes nei at 7.6 %, giant river prawn (4.3 %), giant gourami (4.0 %), tilapia nei (2.9 %), catfishes hybrid (1.8 %), miscellaneous fishes nei (1.4 %), and “pirapatinga” (red-bellied pacu, Piaractus brachypomus (Cuvier, 1818)) at 1.2 %. For the value per volume of major freshwater culture species, the highest was earned by the giant river prawn at US$ 6,488/MT followed by giant gourami at US$ 2,446/MT, common carp at US$ 1,667/MT, tilapia nei at US$ 1,489/MT, pangas catfishes nei at US$ 1,470/MT, torpedo-shaped catfishes at US$ 1,408/MT, catfishes hybrid at US$ 1,360/MT, roho labeo at US$ 1,217/MT, miscellaneous freshwater fishes at US$ 1,158/MT, and “pirapatinga” at US$ 1,071/MT (Table 11).
Furthermore, for the value per volume of production from freshwater culture by country, Singapore presented the highest average value at US$ 9,574/MT mainly coming from its production of the Mozambique tilapia (O. mossambicus). This was followed by Brunei Darussalam at US$ 6,375/MT mainly for its production of the Nile tilapia (Oreochromis niloticus), Malaysia at US$ 2,147/MT mainly for its production of torpedoshaped catfishes nei, Thailand at US$ 1,905/MT also for its production of Nile tilapia, Indonesia at US$ 1,654/MT, Philippines at US$ 1,465/MT, and Myanmar at US$ 1,186/MT.
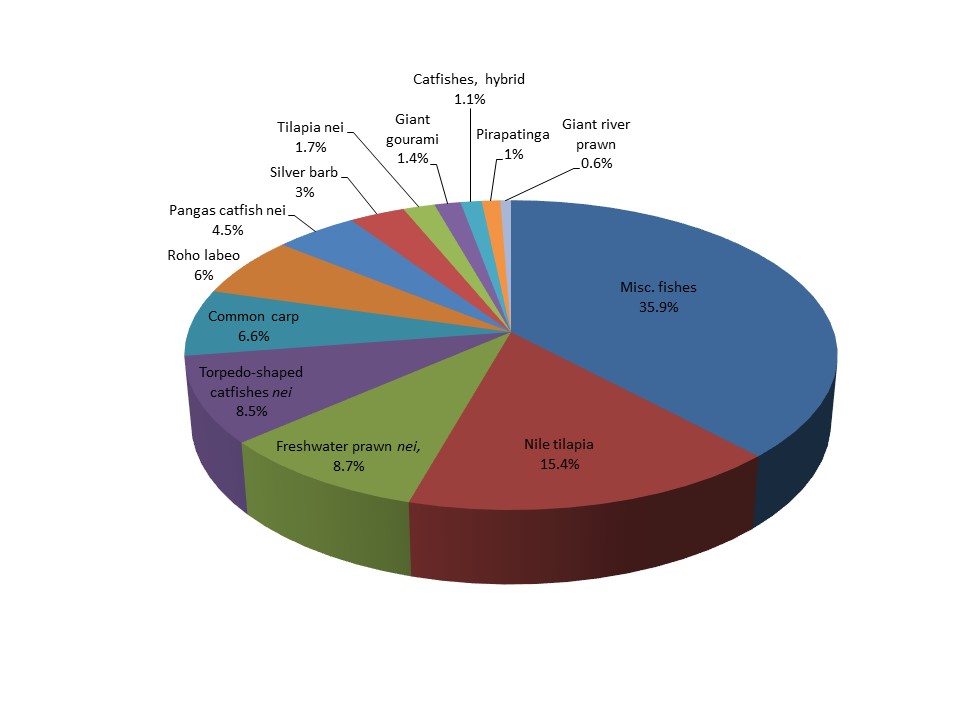
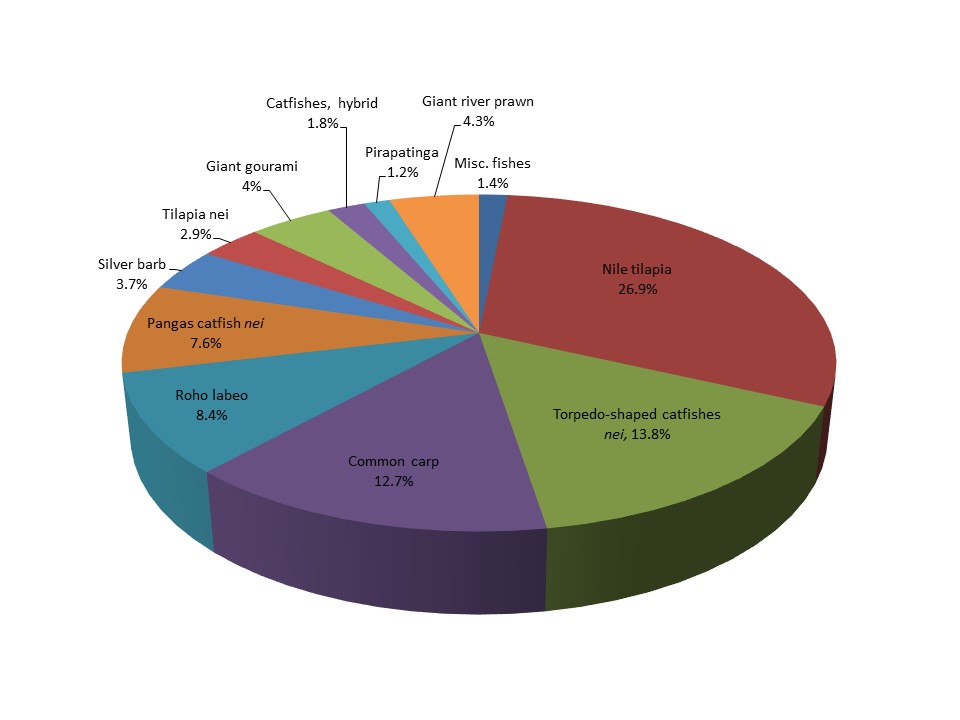
Fig. 8. Production of major freshwater culture species in 2018 (by quantity (left) and value (right))
Table 11. Major freshwater species cultured in the region (as of 2018)
| Common name | Quantity (MT) |
Percentage freshwater culture production of major commodities to total freshwater culture production (%) |
Value (US$ 1,000)* |
Percentage total value of major commodities production from freshwater culture to total freshwater culture value (%) |
Price (US$/MT)** |
| Misc. fishes | 3,345,954 | 35.9 | 109,115 | 1.4 | 1,158 |
| Nile tilapia | 1,436,168 | 15.4 | 2,170,891 | 26.9 | 1,512 |
| Freshwater prawns |
807,850 | 8.7 | … | … | … |
| Torpedo-shaped catfishes |
791,476 | 8.5 | 1,114,727 | 13.8 | 1,408 |
| Common carp | 613,102 | 6.6 | 1,021,831 | 12.7 | 1,667 |
| Roho labeo | 558,481 | 6.0 | 788,529 | 8.4 | 1,217 |
| Pangas catfishes nei |
416,116 | 4.5 | 611,781 | 7.6 | 1,470 |
| Silver barb | 281,333 | 3.0 | 296,161 | 3.7 | 1,053 |
| Tilapias nei | 160,082 | 1.7 | 238,343 | 2.9 | 1,489 |
| Giant gourami | 131,867 | 1.4 | 322,541 | 4.0 | 2,446 |
| Catfishes, hybrid | 106,201 | 1.1 | 144,473 | 1.8 | 1,360 |
| Pirapatinga | 93,332 | 1.0 | 99,938 | 1.2 | 1,071 |
| Giant river prawn |
53,257 | 0.6 | 345,524 | 4.3 | 6,488 |
* Data not available from Cambodia, Lao PDR, and Viet Nam
** Computation of price excludes corresponding quantity production from Cambodia, Lao PDR, and Viet Nam
Fishing Gear Analysis
the region reflected in this Bulletin, was based on the production from marine capture fisheries by type of fishing gear as reported by three countries, namely: Brunei Darussalam, Singapore, and Thailand. The production from marine capture fisheries of the Southeast Asian region by types of gear is shown in Fig. 9. capture fisheries could not be appropriately analyzed as several countries such as Cambodia, Indonesia, Myanmar, Philippines, and Viet Nam were not able to provide the relevant information.
As the highest producing fishing gear, trawls accounted for about 45.00 % of the total production from all types of gears, followed by the purse seines at about 27.30 %,falling net at 9.60 %, gill nets at 7.60 %, lift net at 4.30 %, others at 1.90 %, traps at 1.80 %, push/scoop nets
at 1.50 %, hook and lines at 0.80 %, and seine nets at 0.02 %. However, the trend on gear used in marine capture fisheries could not be appropriately analyzed as several countries such as Cambodia, Indonesia, Malaysia, Myanmar, Philippines, and Viet Nam were not able to provide the necssary information.
From such information, the highest production by type of gears in Brunei Darussalam was from gill nets which accounted for about 60.4 % of the total production of all types of gears, with Penaeus shrimps nei (Penaeus spp.) and shrimp scad (Alepes djedaba) as the main catch. This was followed by purse seines at 14.8 % catching skipjack tuna (Katsuwonus pelamis), hook and lines at 13.4 % catching the narrow-barred Spanish mackerel (Scomberomorus commerson) as the main catch.
For Thailand, trawls gave the highest production by type of gears at about 45.4 % and producing mainly trash fishes that represented about 46.4 %, marine fishes nei at about 9.4 %, common squids nei (Loligo spp.) about 7.8 %, and threadfin breams nei (Nemipterus spp.) about 4.6 %. Purse seines came in second contributing 27.5 % to the production from all types of gears catching scads nei (Decapterus spp.) representing about 13.6 %, Sardinellas nei (Sardinella spp.) about 11.8 %, the Stolephorus anchovies nei (Stolephorus spp.) about 11.2 %, and jack, crevalles nei (Caranx spp.) of about 10.8 %.
In the case of Singapore, trawls gave the highest production by type of gears at about 100.0 % with penaeid shrimps nei (Penaeus spp.) accounting for about 19.4 %, snappers nei (Lutjanus spp.) about 7.5 %, and scads nei (Decapterus spp.) of about 6.3 %.
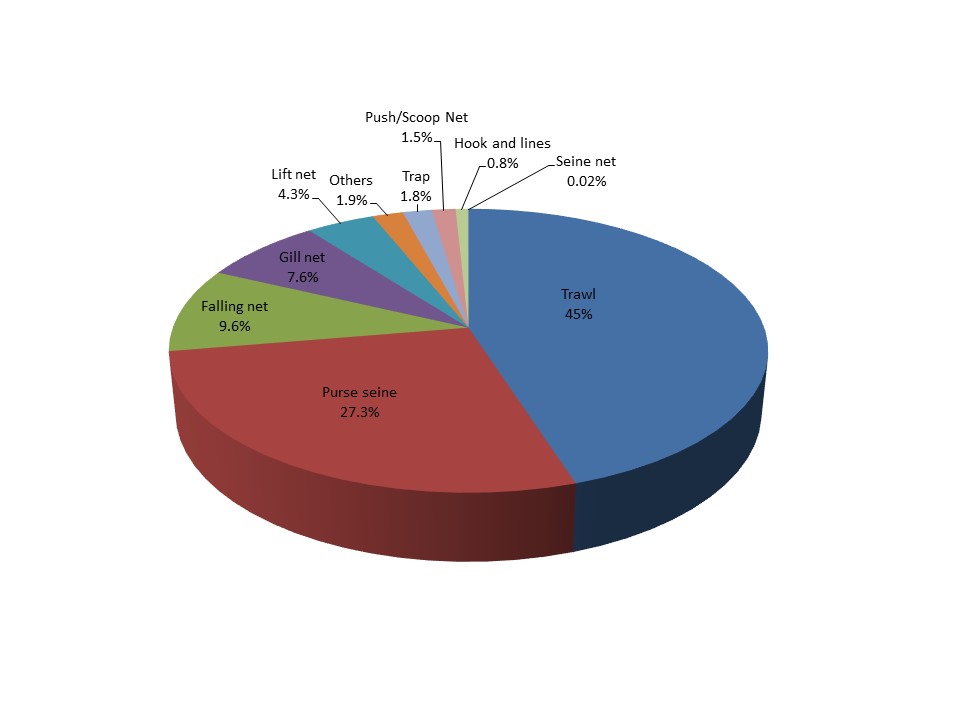
Fig. 9. Marine capture fishery production by type of gear used in 2017
Number of Fishing Boats by Type
Number of Fishers by Working Status
Fig 10. Percentage of fishers by working status in 2018
Efforts to improve the data availability and statistics in support of all efforts to compile the data and information should therefore be intensified by encouraging the countries to enhance the reporting of small-scale fisheries operations through the conduct of census and surveys using questionnaires. This would enable the countries to compile the necessary data and information on fisheries not only on the number of fishers and fish farmers but also the number of fishing vessels and gear used in fishing operations.
Aquaculture Production of Ornamental Fishes
In terms of value, Myanmar reported the highest value which was obtained from Channa pulchra at US$ 0.69/pc followed by Burmese snakehead (Channa harcourtbutleri) at US$ 0.5/pc, Channa burmanica at US$ 0.33/pc, Toxotes blythii at US$ 0.3/pc, Garra flavatra at US$ 0.27/pc, Botia kubotai at US$ 0.26/pc, and Datnioides microlepis at US$ 0.25/pc. In order to have a better picture of the ornamental fish culture industry in Southeast Asia, efforts would be made to improve the compilation of data from this sub-sector considering that this is a budding industry in the region.
Seed Production for Aquaculture
Analysis of Producer Price of Commodities From Capture Fisheries
Meanwhile, the producer price situation in 2018 for certain economically important species of Southeast Asia shows that for inland fish species, the producer price of common carp, Cyprinus carpio in Myanmar was recorded at US$ 2.34/kg while it was US$ 1.55/kg in Thailand. For the Nile tilapia, Oreochromis niloticus the producer price in the Philippines was US$ 2.20/kg compared to Thailand’s US$ 1.86/kg. For striped snakehead (Channa striata) in Thailand was US$ 3.71/kg compared to Myanmar’s US$ 2.93/kg. For other freshwater prawns (Palaemonidae), the producer price in Thailand was quite high at US$ 27.85/kg.
For marine fish species, the producer price of Barramundi (giant sea perch), Lates calcarifer in Brunei Darussalam was US$ 7.10/kg compared to Myanmar’s US$ 3.08/kg. Saurida spp. in Singapore was priced at US$ 2.35/kg compared to Malaysia’s US$ 0.65/kg. Grouper nei, Epinephelus spp. in Thailand costs US$ 11.14/kg compared to US$ 4.29/kg in Indonesia. Meanwhile, for threadfin breams nei (Nemipterus spp.), the producer price in Singapore was US$ 5.31/kg compared to US$ 1.32/kg in Myanmar. Threadfins and tasselfishes nei (Polynemidae) in Singapore was US$ 11.49/kg compared to US$ 4.02/kg in Thailand. Likewise, for silver pomfret (Pampus argenteus), the producer price in Thailand was quite high at US$ 18.57/kg.
The producer price of the yellowfin tuna (Thunnus albacares) was highest in Indonesia at US$ 3.66/kg while the lowest was in Brunei Darussalam at US$ 1.58/kg. For the yeallowtail scad (Atule mate) the producer price in Brunei Darussalam was US$ 4.48/kg while the lowest price was US$ 1.77/kg in Indonesia.
For the blue swimming crab (Portunus pelagicus), the highest producer price was reported by Thailand at US$ 9.28/kg while the lowest was US$ 1.94/kg in Brunei Darussalam. For the giant tiger prawn (Penaeus monodon), the producer price in Brunei Darussalam was quite high at US$ 12.71/kg, while cuttlefish and squids nei (Sepiidae) in Thailand was US$ 6.19/kg compared to US$ 3.58/kg in Singapore. As could be gleaned from the abovementioned information, the trends of the producer prices of the same commodities from among the countries in the region had generally wide variations.