 SEAFDEC Southeast Asian Fisheries Development Center
OVERVIEW OF THE FISHERIES SECTOR OF SOUTHEAST ASIA IN 2017
Fish and fishery products are becoming more increasingly important as primary sources of protein for many peoples in the world, most especially for those in the Southeast Asian region. During the past decade, the region’s production from capture fisheries and aquaculture has been considerably increasing, and recently, many Southeast Asian countries are among the highest producers of fish and fishery products in the world. This publication is therefore intended to provide the readers with a glimpse of the increasing contribution of Southeast Asia’s fishery and aquaculture production to the world’s food fish basket. Based on the data and statistics provided by the Southeast Asian countries, SEAFDEC compiled and analyzed the necessary information for this publication. Of the 11 countries that comprise the Southeast Asian region, namely: Brunei Darussalam, Cambodia, Indonesia, Lao PDR, Malaysia, Myanmar, Philippines, Singapore, Timor- Leste, Thailand, and Viet Nam, only ten countries are covered with this publication as Timor-Leste has not yet been providing its fishery statistics and information to SEAFDEC.
Total Fishery Production of Southeast Asia
Table 1. Fishery production by continent from 2013 to 2017 (million MT)*
| 2013 | 2014 | 2015 | 2016 | 2017 | |
| World | 188.9 | 193.4 | 199.2 | 202.2 | 205.5 |
| Africa | 10.1 | 10.5 | 10.8 | 11.4 | 11.9 |
| America | 22.4 | 20.8 | 21.3 | 20.0 | 21.4 |
| Asia** | 100.3 | 103.7 | 104.7 | 106.9 | 106.9 |
| Southeast Asia*** | 40.1 | 42.1 | 44.0 | 45.3 | 45.5 |
| Europe | 16.5 | 16.9 | 17.3 | 16.9 | 18.1 |
| Oceania | 1.4 | 1.5 | 1.6 | 1.7 | 1.7 |
* Source (except for Southeast Asia): FAO FishStat Plus-Universal Software for Fishery Statistical Time Series
** Excludes Southeast Asia
*** Source: Fishery Statistical Bulletin of Southeast Asia (SEAFDEC, 2020)
Table 2 shows that the fishery production of Southeast Asia from 2013 to 2017, which exhibited a continuously increasing trend especially in terms of quantity although the increases in terms of value were quite unstable. The annual average increase in quantity from 2013 to 2017 was 3.2%, while the annual average rate of increase of the value was about 5.5%. However, some countries were not able to provide the value of their respective fishery production for 2017, for example Viet Nam, Cambodia, and Lao PDR. Nevertheless, the figures still imply that in addition to the increasing quantity, most of the fishery commodities harvested in the region were of high value. By country, Indonesia reported the highest fishery production in 2017 in terms of quantity accounting for about 50.2% of the total fishery production of Southeast Asia, followed by Viet Nam contributing about 16.0% and Myanmar at 12.5%. The Philippines ranked next accounting for 9.5%, Thailand at 5.2%, Malaysia at 4.2%, and Cambodia at 1.9%. The contributions of Lao PDR, Brunei Darussalam and Singapore to the fishery production of Southeast Asia in 2017, were minimal in terms of quantity.
In terms of value, Indonesia accounted for about 55.8% of the total value of the region’s fishery production with Myanmar emerging second contributing about 18.5%, and Thailand came in third contributing about 9.3%. Meanwhile, the Philippines ranked fourth in terms of quantity and value, contributing about 9.0%, and Malaysia which ranked fifth in terms of production quantity as well as value accounted for 7.1%. The trend of the fishery production of the Southeast Asian countries in 2013-2017 is shown in Fig. 1. The drastic drop in the value of fishery production of Viet Nam may not have been due to very low or no value, but because of the inability of the country to provide the necessary information on time.
Table 2. Total fishery production of Southeast Asia by quantity and value (2013-2017)
| Fishery Production |
2013 | 2014 | 2015 | 2016 | 2017 |
| Quantity (MT) |
40,150,808 | 42,117,647 | 43,998,242 | 45,336,312 | 45,496,587 |
| Value (US$ 1,000) |
41,892,690* | 42,722,414** | 38,746,241* | 40,973,100* | 50,564,226* |
* Data not available from Cambodia, Lao PDR and Viet Nam
** Data not available from Cambodia and Viet Nam

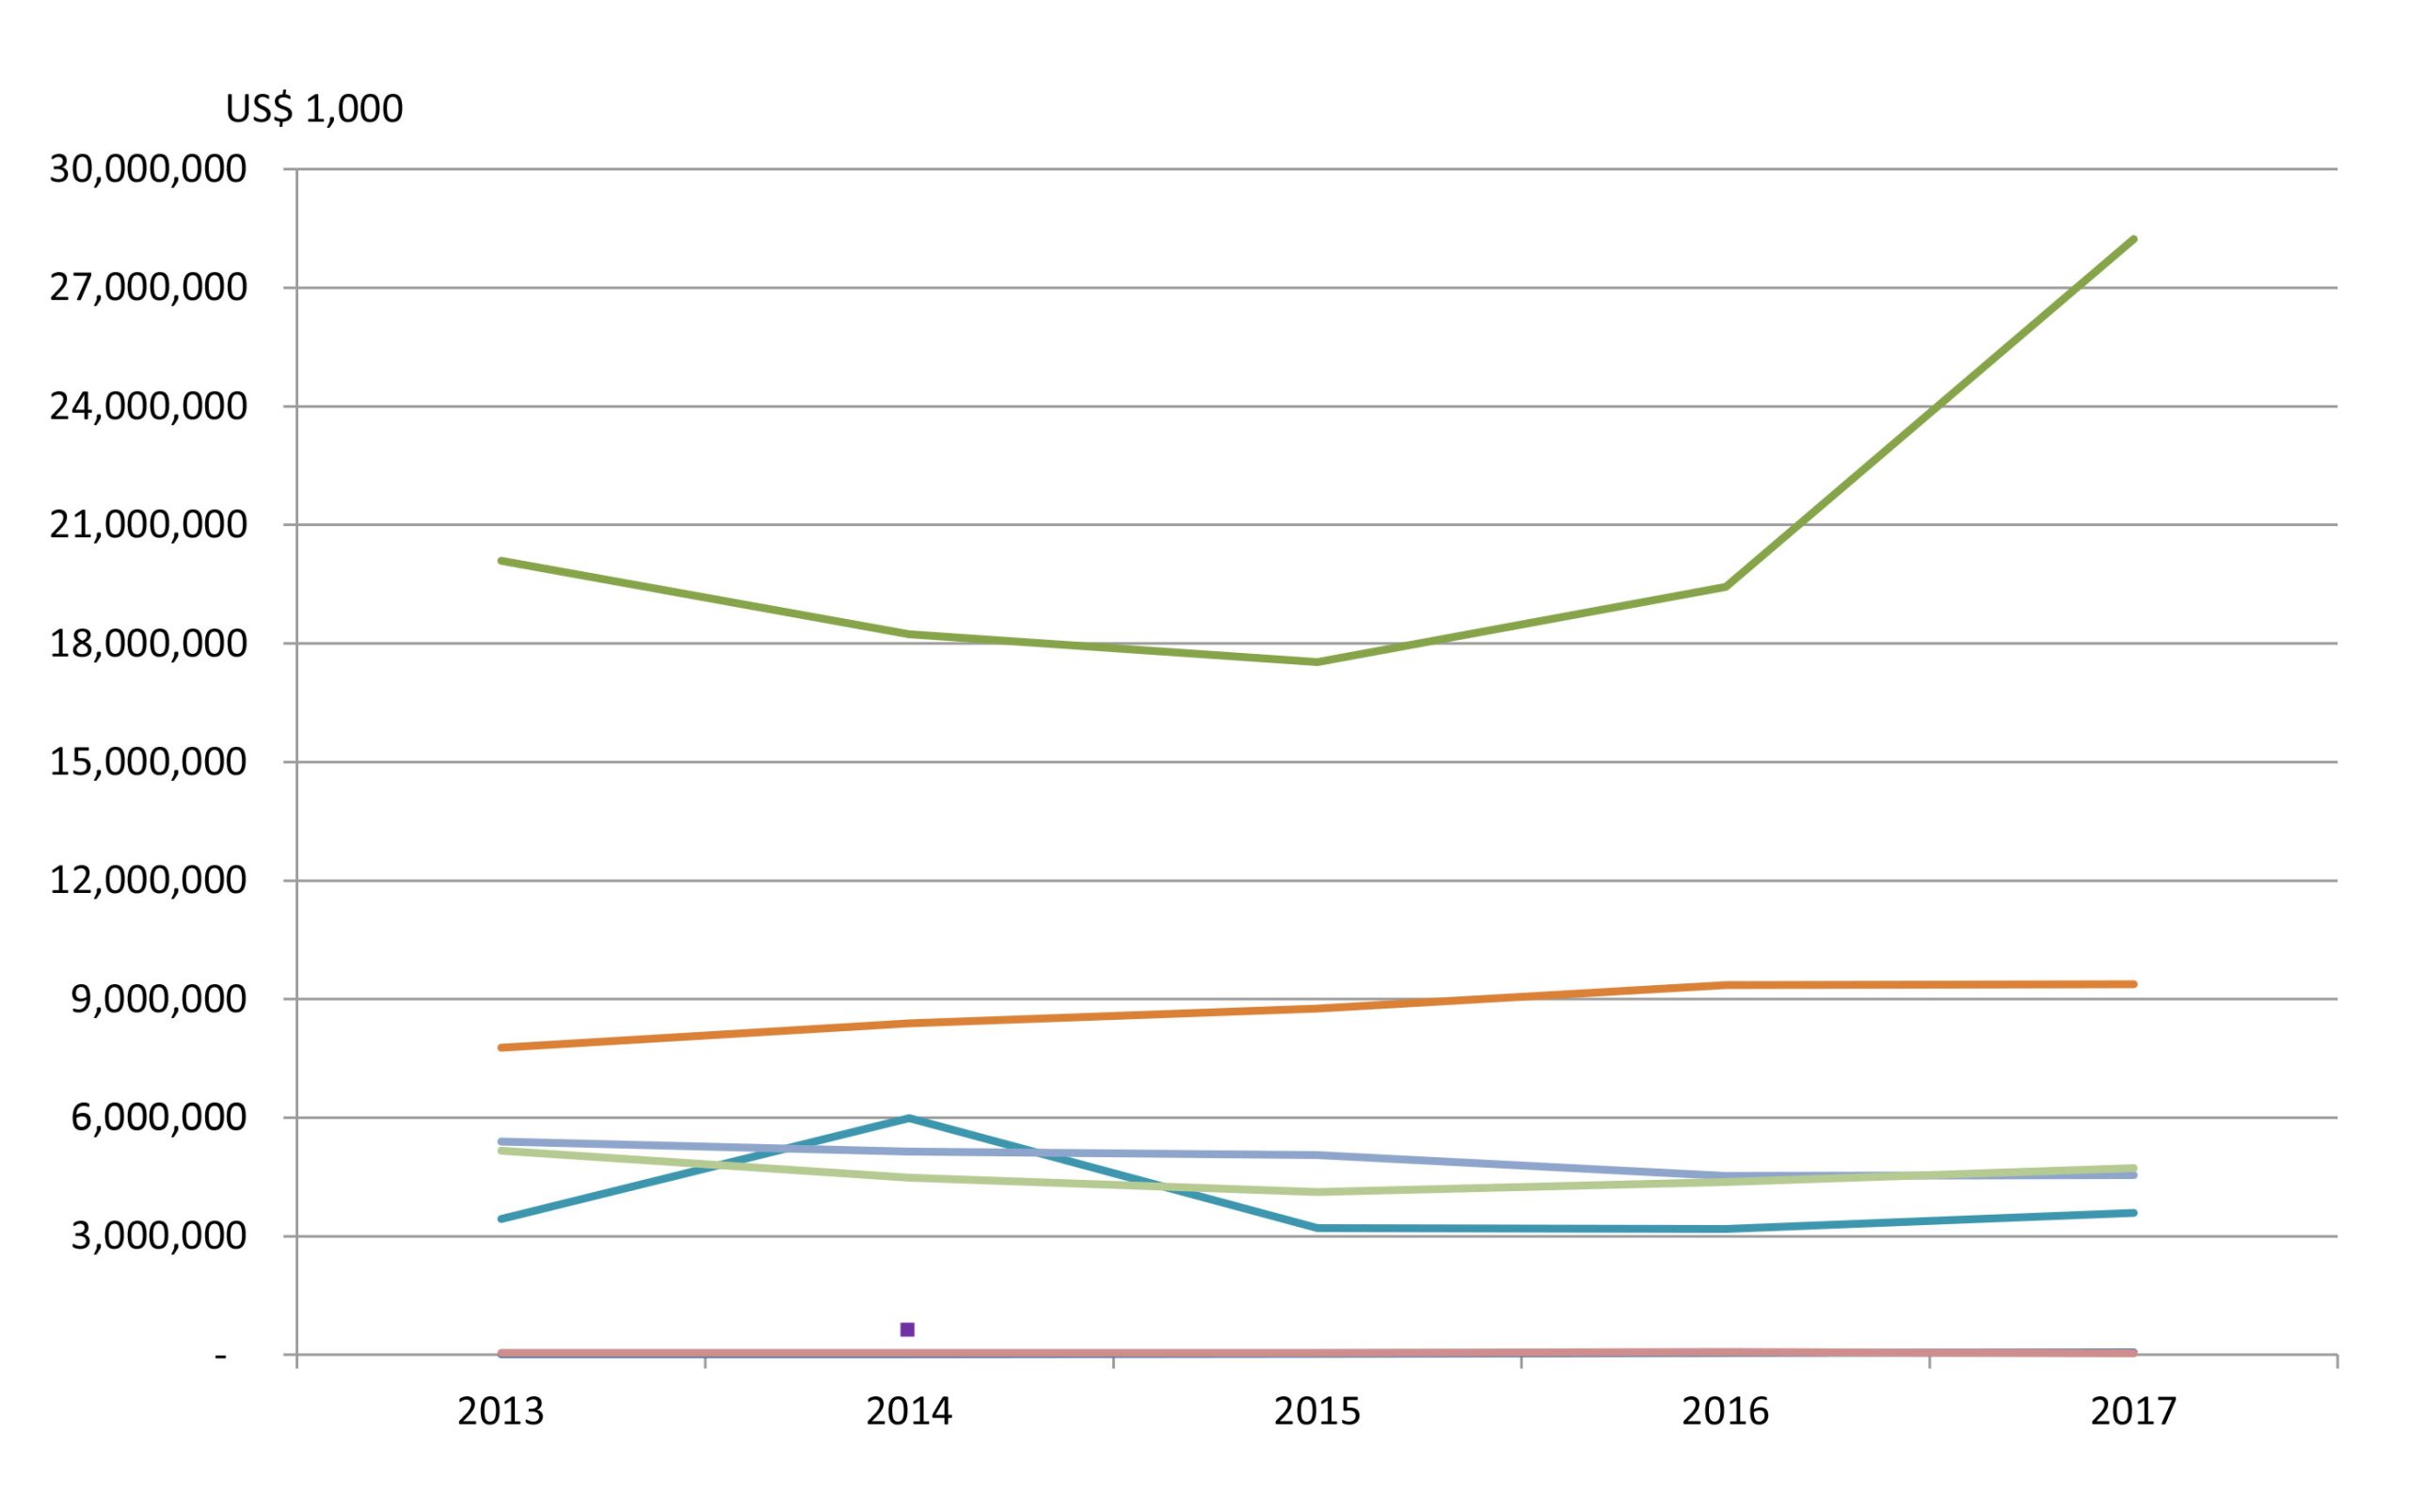
Fig. 1 Fishery production of the Southeast Asian countries in 2013-2017 (left in quantity; right in value)
The fishery production of Southeast Asia comes from three sub-sectors, namely: marine capture fisheries, inland capture fisheries, and aquaculture. By sub-sector, the total fishery production of the region in 2017 as shown in Table 3 indicates that the largest portion of the production volume was derived from aquaculture accounting for approximately 54.8% followed by marine capture fisheries at about 38.1% and inland capture fisheries at 7.1%. In terms of production value, the trend was quite different as marine capture fisheries accounted for 50.0%, aquaculture at 42.0%, and inland capture fisheries at 8.0% (Fig. 2). While the value per quantity of marine capture fishery products was about US$ 1,807/MT, those from inland capture fisheries and aquaculture were about US$ 1,661/MT and US$ 1,025/MT, respectively. This implies that the global market had started to recognize the value of aquatic products harvested through inland capture fisheries, and had been lately patronizing such products.
Table 3. Fishery production (quantity and value) of Southeast Asia in 2017
| Sub-sector | Quantity (MT) |
Value* (US$ 1,000) |
Value/Quantity** (US$/MT) |
| Marine capture fisheries | 17,330,277 | 25,292,021 | 1,807 |
| Inland capture fisheries | 3,226,154 | 4,018,366 | 1,661 |
| Aquaculture | 24,940,156 | 21,253,839 | 1,025 |
| Total | 45,496,587 | 50,564,226 |
* Data not available from Cambodia, Lao PDR and Viet Nam
** Computation of price excludes corresponding quantity production from Cambodia, Lao PDR, and Viet Nam
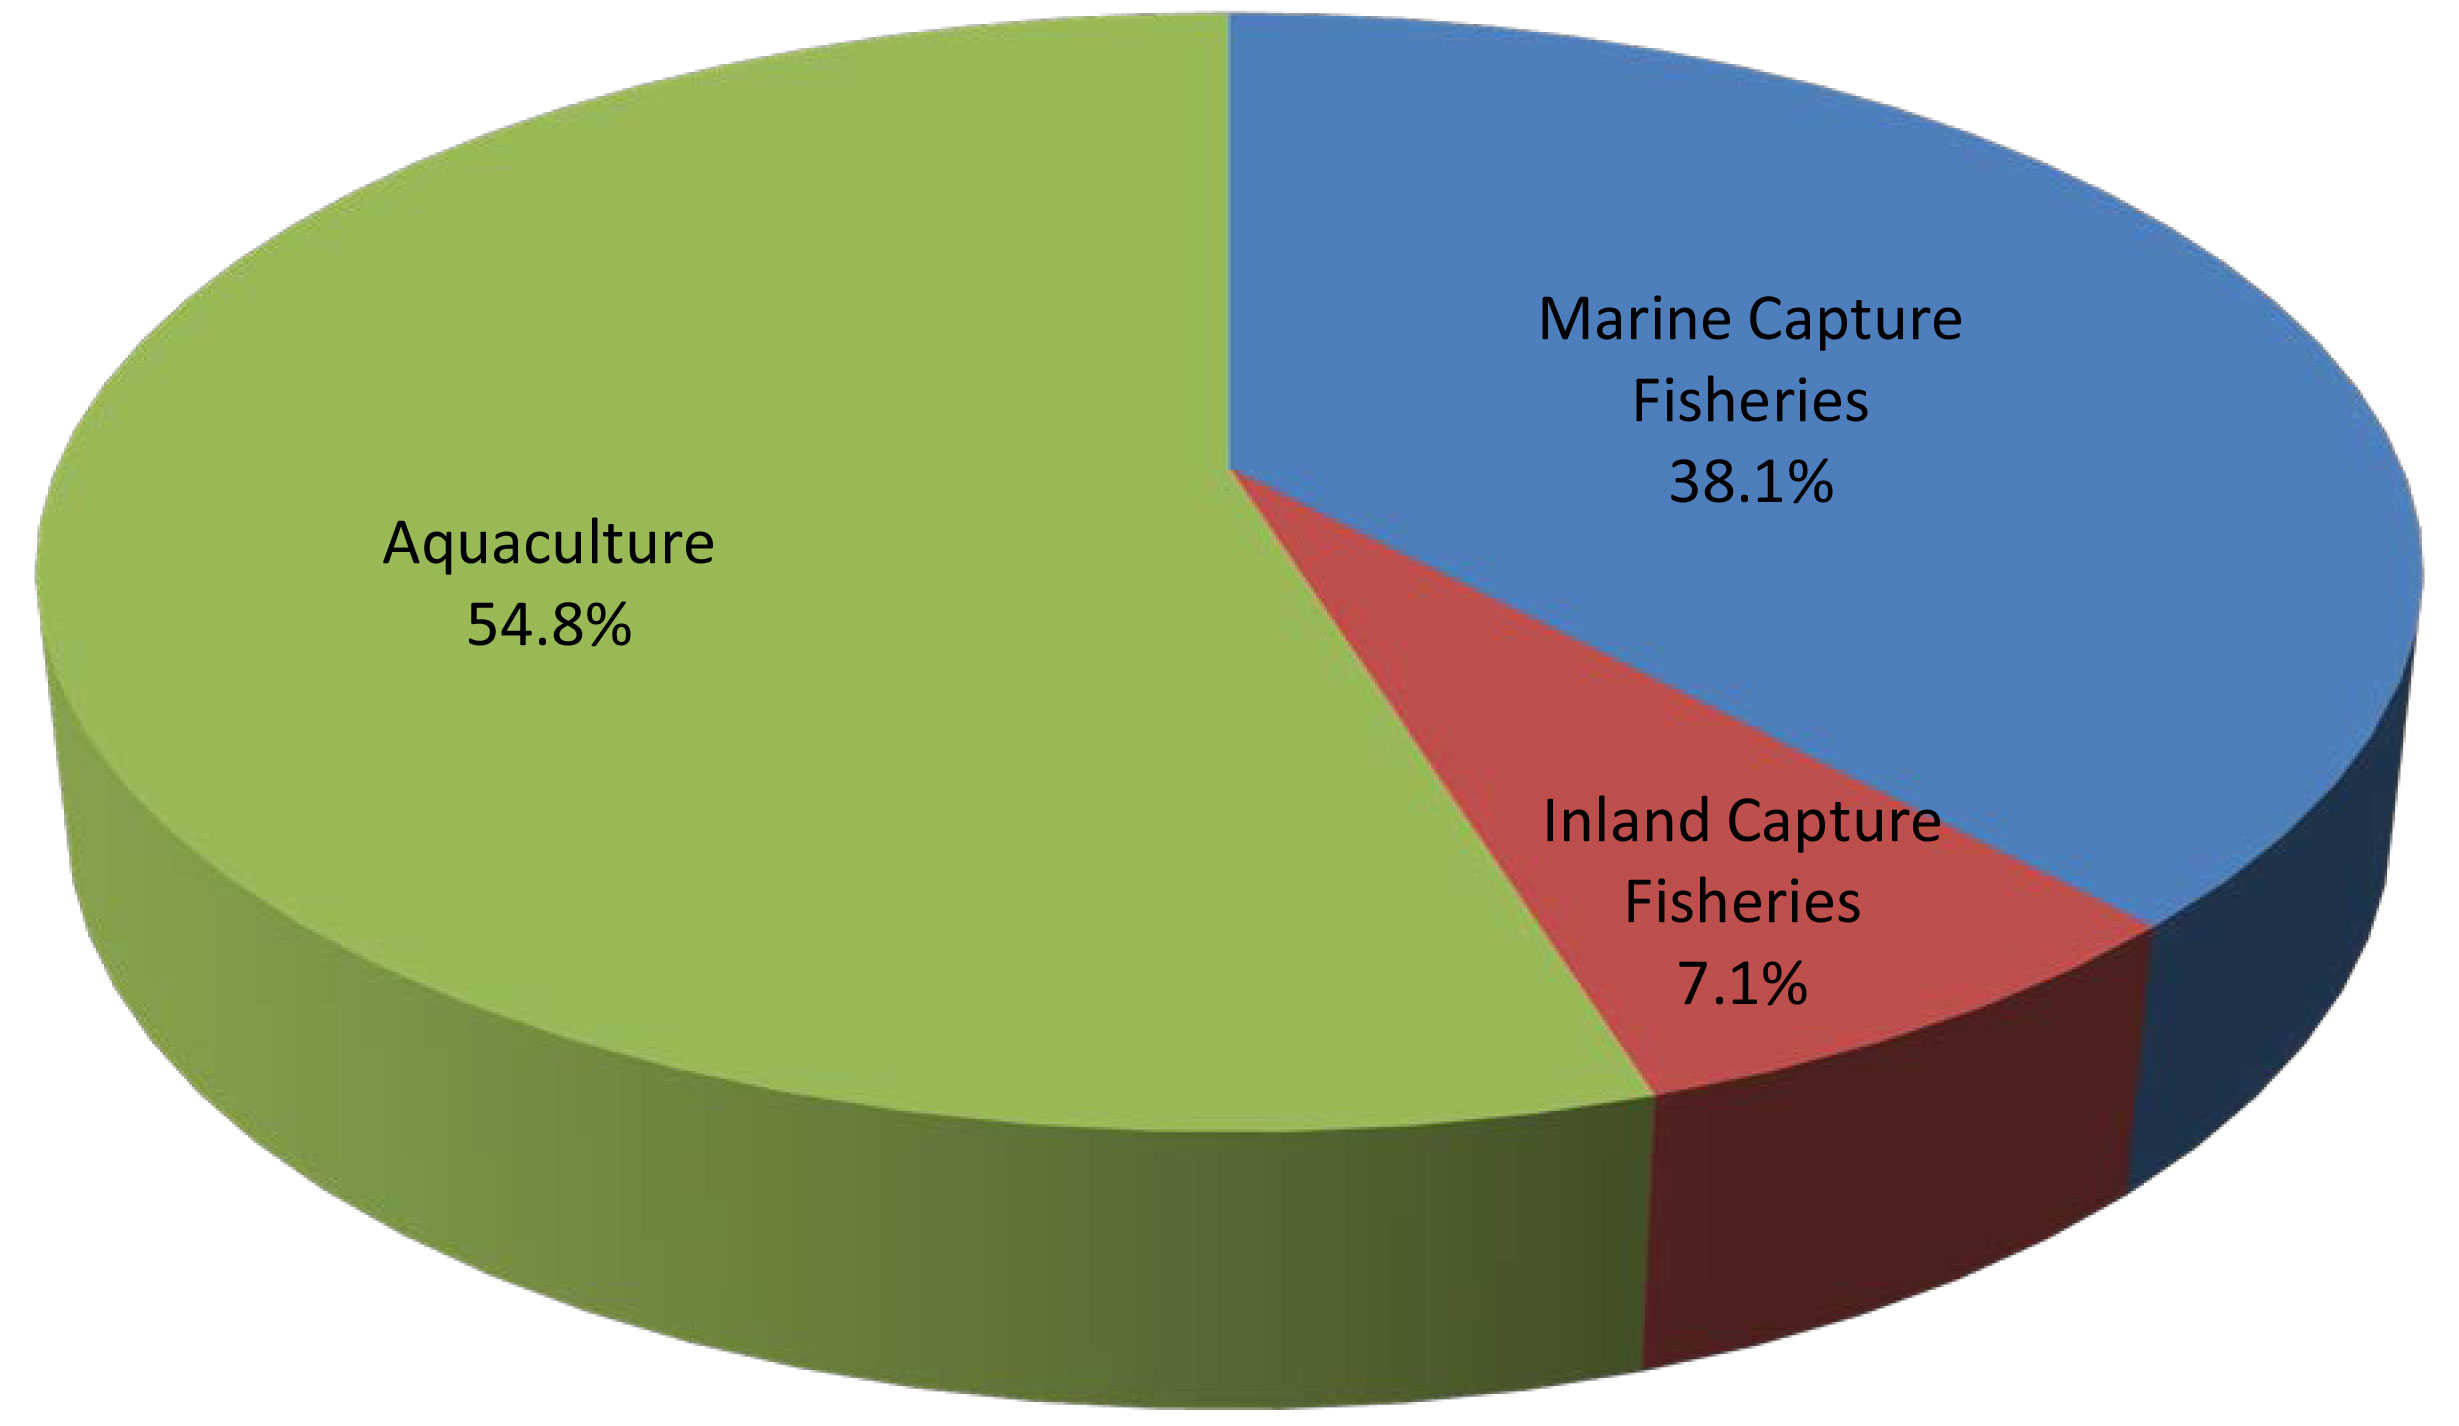
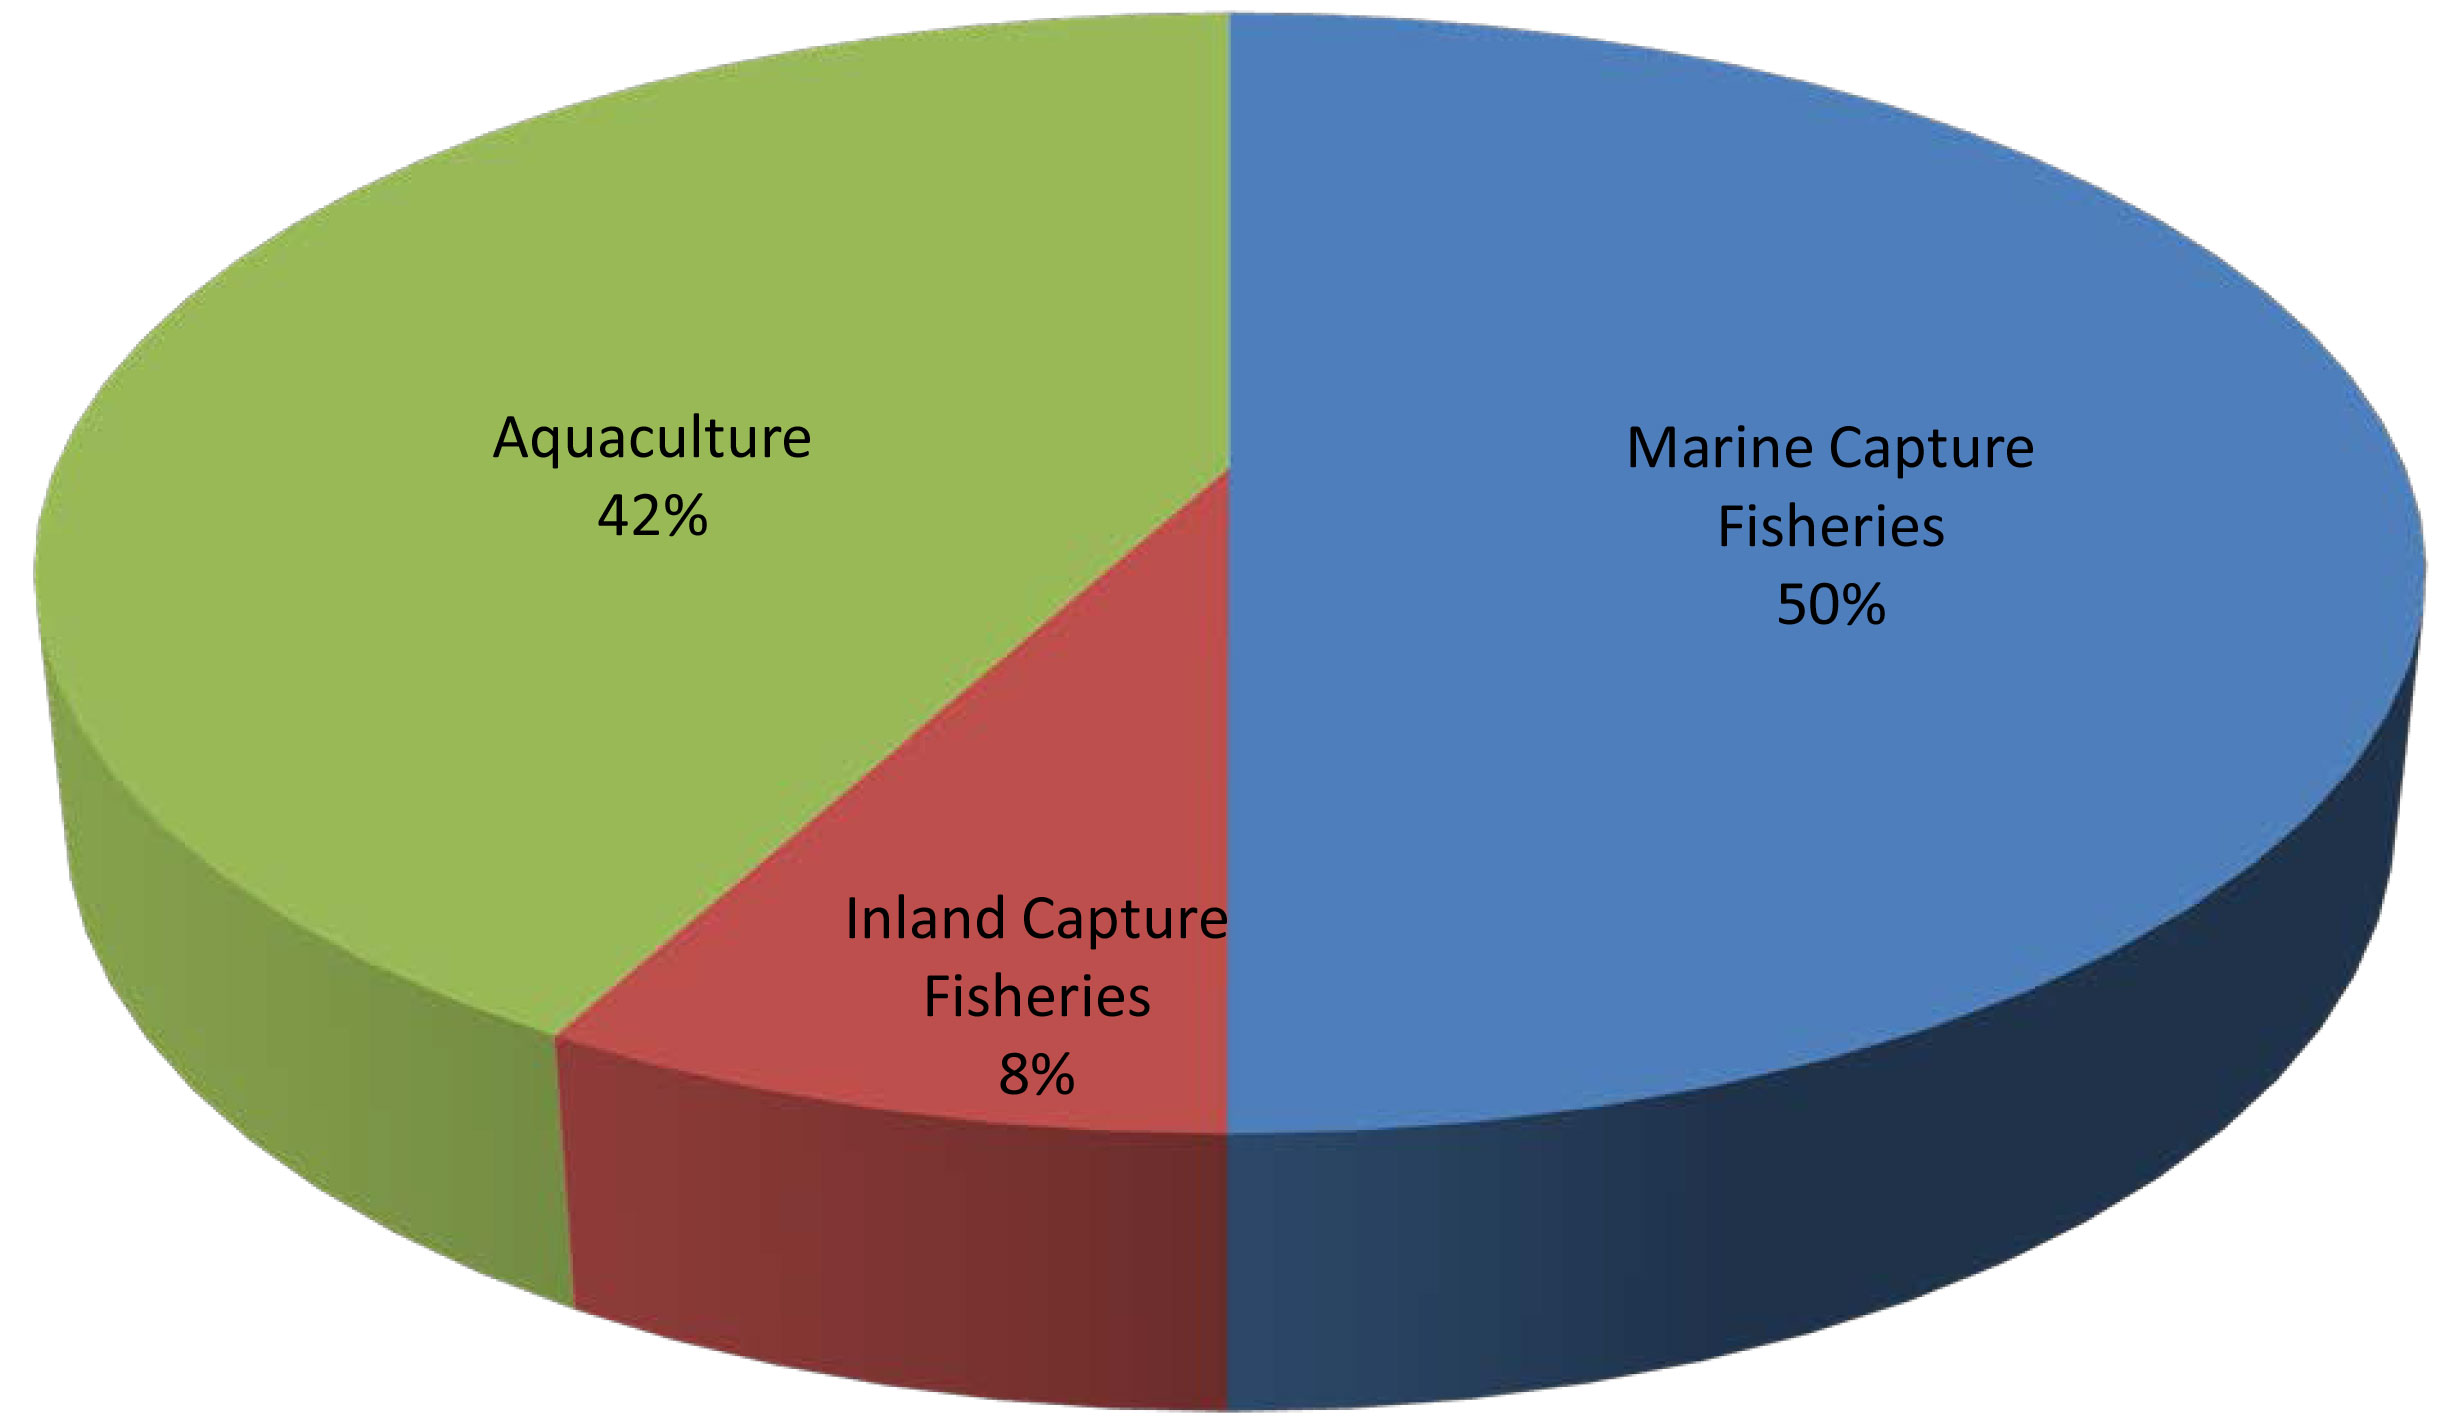
Fig. 2 Percentage of the sub-sectors’ contribution to Southeast Asia’s fishery production in 2017 (left in quantity; right in value)
Marine Capture Fishery Production of Southeast Asia
Table 4. Marine capture fishery production of Southeast Asia by quantity and value (2013-2017)
| Marine capture fishery production |
2013 | 2014 | 2015 | 2016 | 2017 |
| Quantity (MT) | 16,137,163 | 16,853,626 | 16,762,392 | 17,027,312 | 17,330,277 |
| Value (US$ 1,000) | 20,585,615* | 21,654,307* | 19,481,510* | 19,939,678* | 25,292,021* |
* Data not available from Cambodia and Viet Nam
In terms of quantity, the total production from marine capture fisheries of the Southeast Asian countries during 2013-2017 indicated that Indonesia contributed the highest production to the region’s total. Specifically in 2017, Indonesia’s production was 6.27 million MT accounting for approximately 36.2% of the region’s total, followed by Viet Nam, Myanmar, and Philippines at 3.21 million MT (18.5%), 3.04 million MT (17.5%), and 1.91 million MT (11.03%), respectively. Malaysia and Thailand had also produced considerable amount of aquatic commodities from marine capture fisheries at 1.46 million MT (8.45%) and 1.30 million MT (7.5%), respectively. A picture of the region’s production quantity from marine capture fisheries in 2017 could be gleaned from Fig. 3.

Fig. 3. Marine capture fishery production of Southeast Asia in 2017
Although some Southeast Asian countries were not able to provide the value of their production from marine capture fisheries, the trend of the total value of the region’s marine capture fishery production from 2013 to 2017 seemed to have increased corresponding to the increasing trend of the region’s production quantity. By country, Indonesia which led the Southeast Asian countries, accounted for about 52.2% of the region’s marine capture fishery production value in 2017, with Myanmar emerging second contributing about 20.4%. Meanwhile, Malaysia which came in third in terms of value contributed about 11.0%, the Philippines came in fourth at 9.4%, and lastly, Thailand contributed about 6.8%.
Aggregating the 2017 production quantity from marine capture fisheries by major commodity groups, marine fishes provided the highest quantity (Table 5) accounting for about 85.9% followed by molluscs at 4.8% while the crustaceans, invertebrates and seaweeds contributed 4.1%, 0.5%, and 0.3%, respectively. It should be noted that 4.4% was contributed by other commodity groups which could not be appropriately classified as some countries e.g. Viet Nam, were not able to provide their respective production quantity by species. In 2017, the production quantity of invertebrates had slightly decreased from that of 2016 by about 12.3%, but the production quantity of molluscs, seaweeds, crustaceans, and marine fishes had increased by about 53.6%, 14.0%, 1.4% and 1.0%, respectively, compared with the corresponding quantity in 2016.
Table 5. Production of the major commodity groups from marine capture fishery in Southeast Asia (in MT)
| Commodity Group | 2013 | 2014 | 2015 | 2016 | 2017 |
| Marine fishes | 14,032,382 | 14,624,488 | 14,310,199 | 14,726,719 | 14,880,726 |
| Crustaceans | 656,362 | 627,640 | 636,342 | 708,248 | 718,355 |
| Mollusks | 532,871 | 548,348 | 532,192 | 540,958 | 830,724 |
| Seaweed | … | … | 78,230 | 41,457 | 47,271 |
| Invertebrates | … | 118,016 | 2,609 | 105,886 | 92,901 |
| Others | 915,548 | 935,134 | 1,202,820 | 904,044 | 760,300 |
| Total marine capture fishery production (MT) |
16,152,674 | 16,655,092 | 16,762,392 | 17,027,312 | 17,330,277 |
Comparing the quantity of the total fishery production in 2017 with that of 2016, an increase in production of the marine fishes was obvious, which could have been influenced by various factors that include: Indonesia’s increased production of various major commodities such as skipjack tuna (Katsuwonus pelamis) from fishing area 57 and 71 , as well as yellowfin tuna (Thunnus albacares), bigeye tuna (Thunnus obesus), scads nei (Decapterus spp.), and production of crustaceans; the Philippines’s production of major marine fishes that also increased considerably, especially skipjack tuna (Katsuwonus pelamis) from fishing area 71; and Thailand’s increased production of Carangidae from fishing area 57 and 71.
Moreover, the region’s production of major species such as the Rastrelliger spp. decreased in 2017 compared with that of 2016 which could have been influenced by decreased production of Malaysia and Thailand; Perna viridis (green mussel) production also decreased in 2017 compared with that of 2016, which could have been influenced by decreased production of Malaysia. Meanwhile, production of Portunus pelagicus (blue swimming crab) in 2017 had increased compared with that of 2017, which could have been brought about by Indonesia’s increased production of the crab from fishing areas 57 and 71.
1 Fishing area 71 covers the marine fishing areas of Thailand (Gulf of Thailand), Cambodia, Viet Nam (Southwest and Southwest), Malaysia (East Coast of Peninsular Malaysia, Sabah, Sarawak), Singapore, Brunei Darussalam, Philippines (Luzon, Visayas, Mindanao), and Indonesia (East Sumatra, North Java, Bali-Nusa Tenggara, South-West Kalimantan, East Kalimantan, South Sulawesi, North Sulawesi, Maluku-Papua)
2 Fishing area 57 covers the marine fishing areas of Myanmar, Thailand (Indian Ocean), Malaysia (West Coast of Peninsular Malaysia), and Indonesia (Malacca Strait, West Sumatra and South Java, Bali-Nusa Tenggara)
The economically-important marine species that provided sizeable contribution to the total fishery production of Southeast Asia from marine capture fisheries (by quantity and value) in 2017 are shown in Table 6. The data indicate that miscellaneous marine fishes (unidentified) contributed the highest quantity at about 37.11% and value at about 21.68%. Production from the tunas group contributed about 10.06% to the total production quantity and ranked the second highest, although it was ranked the highest in terms of value accounting for about 4.17% of the total production value. In terms of production value, tunas group had decreased in 2017 compared with that of 2016 due to the missing corresponding production value by species from Indonesia.
Table 6. Economically-important marine species caught in the region in 2017
| Group/species | Quantity (MT) |
Percentage of total quantity of marine capture fishery production (%) |
Value (US$1,000)* |
Percentage of total value of marine capture fishery production (%) |
Prices (US$/MT) |
| Tunas Frigate tuna Bullet tuna Kawakawa Skipjack tuna Longtail tuna Albacore tuna Southern bluefin tuna Yellowfin tuna Bigeye tuna |
1,743,103 135,387 13,801 275,959 718,085 168,062 8,470 835 287,409 135,095 |
10.06 |
1,055,884 172,480 … 121,225 325,626 107,712 4,002 … 237,865 86,974 |
4.17 |
1,579 1,379 … 1,383 1,299 1,614 2,713 … 2,192 3,039 |
| Scads Bigeye scad Yellowstripe scad Torpedo scad Other scads |
1,116,244 204,124 175,429 86,619 650,072 |
6.44
|
753,239 236,021 21,326 89,443 406,446 |
2.98
|
1,254 1,248 1,535 1,223 1,252 |
| Mackerels Scomber mackerels Indian mackerels Seerfishes |
1,013,046 3,730 738,914 270,402 |
5.85
|
376,942 … 224,340 152,602 |
1.49
|
1,117 … 760 3,711 |
| Anchovies Stolephorus anchovies Other anchovies |
494,907 374,098 120,809 |
2.86 | 178,962 119,637 59,325 |
0.71
|
884 1,469 491 |
| Crustaceans | 1,036,753 | 5.98 | 955,610 | 3.78 | 3,576 |
| Mollusks | 512,326 | 2.96 | 763,544 | 3.02 | 2,953 |
| Marine fishes unidentified |
6,431,870 | 37.11 | 5,483,712 | 21.68 | 1,465 |
* Data not available from Cambodia, Indonesia and Viet Nam
** Computation of price excludes corresponding quantity production from Cambodia, Indonesia, and Viet Nam
The data in Table 6 also suggest that the production price (value/quantity) of seerfishes group is valued the highest among the commodities harvested through marine capture fisheries at US$ 3,711/MT followed by crustaceans group at US$ 3,576/MT, then bigeye tuna (Thunnus obesus) at US$ 3,039/MT; molluscs group at US$ 2,953/MT; albacore tuna (Thunnus alalunga) at US$ 2,713/MT; yellowfin tuna (Thunnus albacares) at US$ 2,192/MT; longtail tuna (Thunnus tonggol) at US$ 1,614/MT; yellowstripe scad (Selaroides leptolepis) at US$ 1,535/MT; Stolephorus anchovies nei (Stolephorus spp.) at US$ 1,469/MT; miscellaneous marine fishes (unidentified) at US$ 1,465/MT; kawakawa (Euthynnus affinis) at US$ 1,383/MT; frigate tuna (Auxis thazard), at US$ 1,379/MT; skipjack tuna (Katsuwonus pelamis) at US$ 1,299/MT; scads group at US$ 1,252MT; bigeye scad (Selar crumenophthalmus) at US$ 1,248/MT; Torpedo scad (Megalaspis cordyla) at US$ 1,223/MT; Indian mackerels group at US$ 760/MT; and other anchovies at US$ 491/MT.
Inland Capture Fishery Production of Southeast Asia
While countries reported their respective data on production from inland capture fisheries during 2013- 2017, only five countries reported their corresponding production values. At any rate, as the consistent top producer, Myanmar maintains a stable inland fishery production from 2013 to 2017 that accounted for 34.4% of the country’s total production from capture fisheries, 28.0% of the country’s total fishery production, and 3.5% of the region’s total fishery production (Table 7).
Table 7. Contribution of Southeast Asian countries’ inland capture fisheries to the region’s total fishery production in 2017
| Country | Inland capture production (MT) |
Total capture production (MT) |
% of inland capture production to total capture production |
Total fishery production (MT) |
% of inland capture fishery production to total fishery production |
| Brunei Darussalam |
… | 13,795 | … | 15,427 | … |
| Cambodia | 528,493 | 649,518 | 81.4 | 857,018 | 61.7 |
| Indonesia | 461,531 | 3,735,640 | 6.9 | 22,850,630 | 2.0 |
| Lao PDR | 70,900 | 70,900 | 100 | 180,777 | 39.2 |
| Malaysia | 5,177 | 1,470,294 | 0.35 | 1,897,258 | 0.3 |
| Myanmar | 1,590,360 | 4,626,500 | 34.4 | 5,675,462 | 28.0 |
| Philippines | 163,870 | 2,074,876 | 7.9 | 4,312,663 | 3.8 |
| Singapore | … | 1,098 | … | 6,989 | … |
| Thailand | 192,623 | 1,493,044 | 12.9 | 2,386,916 | 8.1 |
| Viet Nam | 207,200 | 3,420,500 | 6.1 | 7,313,400 | 2.8 |
| Total | 3,226,154 | 20,556,435 | 15.89 | 45,496,540 | 7.1 |
The second highest producer, Cambodia reported a production quantity of 528,493 MT in 2017 that represented 81.4% of the country’s production from capture fisheries, 61.7% of the country’s total fishery production, and 1.2% of the region’s total fishery production. However, such production quantity could not be confirmed as accurate considering that the country needs to improve its systems of collecting and compiling the fishery statistics, especially with regards to the production from inland capture fisheries.
Only four countries, namely: Brunei Darussalam, Indonesia, Philippines, and Thailand, had provided their respective production data from inland capture fisheries by species, while the other countries, i.e. Cambodia, Lao PDR, Malysia, Maynmar, and Viet Nam, were not able to report due to inadequacy of expertise in identifying the catch by species. Capacity building in this aspect is therefore necessary to enable the countries to compile their respective inland fishery production by major groups of species. However, it could be noted tha the production of Indonesia as the region’s third highest producer was made up mainly of the Nile tilapia (Oreochromis niloticus) which accounted for about 14.9% of the country’s total production from inland capture fisheries.
Next to miscellaneous fishes which provided the highest production from inland capture fisheries accounting for 71.6% of the region’s total inland fishery production in 2017 (Table 8), production of Nile tilapia (Oreochromis niloticus) was the second highest at 2.8% followed by freshwater mollucks nei at 2.6%, striped snakehead (Channa striata) at 1.9%, and silver barb (Barbonymus gonionotus) at 1.4%. Although the current reported production of the giant river prawn (Macrobrachium rosenbergii) was relatively low at 23,995 MT, its value per quantity of production was the highest at US$ 4,494/MT followed by glass catfishes at US$ 3,096/MT, Pangasius djambal at US$ 2,802/MT, and striped snakehead at US$ 2,038/MT.
Table 8. Production of major inland fisheries species in Southeast Asia in 2017
| Common name | Quantity (MT) |
Percentage total quantity of major inland species to total inland capture production (%) |
Value (US$ 1,000)* |
Percentage total value of major inland species to total inland capture production (%) |
Price (US$/MT)** |
| Misc. fishes | 2,309,311 | 71.6 | 2,647,763 | 65.9 | 1,547 |
| Nile tilapia | 89,540 | 2.8 | 141,196 | 3.5 | 1,577 |
| Freshwater mollusks nei | 84,728 | 2.6 | 12,549 | 0.3 | 148 |
| Striped snakehead | 59,904 | 1.9 | 122,110 | 3.0 | 2,038 |
| Silver barb | 45,898 | 1.4 | 56,241 | 1.4 | 1,225 |
| Tilapias nei | 43,240 | 1.3 | 50,142 | 1.2 | 1,160 |
| Asian redtail catfish | 41,621 | 1.3 | 96,751 | 2.4 | 2,324 |
| Pangasius djambal |
39,206 | 1.2 | 109,856 | 2.7 | 2,802 |
| Snakeskin gourami | 34,481 | 1.1 | 35,760 | 0.9 | 1,026 |
| Torpedo-shaped catfishes nei |
27,325 | 0.8 | 50,312 | 1.2 | 1,841 |
| Giant river prawn | 23,995 | 0.7 | 107,828 | 2.7 | 4,494 |
| Glass catfishs | 23,304 | 0.7 | 72,143 | 1.8 | 3,096 |
| Climbing perch | 22,061 | 0.7 | 32,378 | 1.8 | 1,468 |
* Data not available from Cambodia, Lao PDR, and Viet Nam
** Computation of price excludes corresponding quantity production from Cambodia, Lao PDR, and Viet Nam
Aquaculture Production of Southeast Asia
For Indonesia as the largest producer of aquaculture products in 2017, production of spiny eucheuma (Eucheuma denticulatum) contributed 58.9% in terms of production quantity and 7.1% in production value to the country’s aquaculture production. This was followed by Nile tilapia (Oreochromis mossambicus) accounting for 7.9%, torpedo-shaped catfishes (Clarias spp.) at 7.0%, and Gracilaria seaweeds (Gracilaria spp.) at 6.6%. In the case of Viet Nam, as the second highest producer from aquaculture, 70.0% of its aquaculture production came from the group of freshwater fishes (unidentifies species) followed by freshwater prawns which accounted for 19.1% of the country’s aquaculture production.
For the Philippines as the third highest producer from aquaculture, its main aquaculture product is the elkhorn sea moss (Kappaphycus alvarezii) contributing 59.4% to the country’s production from aquaculture followed by milkfish (Chanos chanos) accounting for 18.4%, Nile tilapia (Oreochromis niloticus) at 7.4%, and spiny eucheuma (Eucheuma denticulatum) at 3.7%. For Myanmar, its main production from aquaculture is roho labeo (Labeo rohita) which accounted for 61.8% of the country’s production from aquaculture followed by mrigal carp (Cirrhinus mrigala) accounting for 6.9%, catla (Catla catla) accounting for 6.4%, giant tiger shrimp (Penaeus monodon) at 5.3%, pangas catfishes nei (Pangasius spp.) at 4.1%, and tilapias (Oreochromis(=Tilapia) spp.) at 3.2%. Thailand’s main aquaculture product is the whiteleg shrimp (Penaeus vannamei) accounting for 38.7% of the country’s production from aquaculture followed by Nile tilapia (Oreochromis niloticus) at 24.4%, hybrid catfishes (C. gariepinus x C. macrophalus) at 11.8%, and green mussel (Perna viridis) at 5.6%.
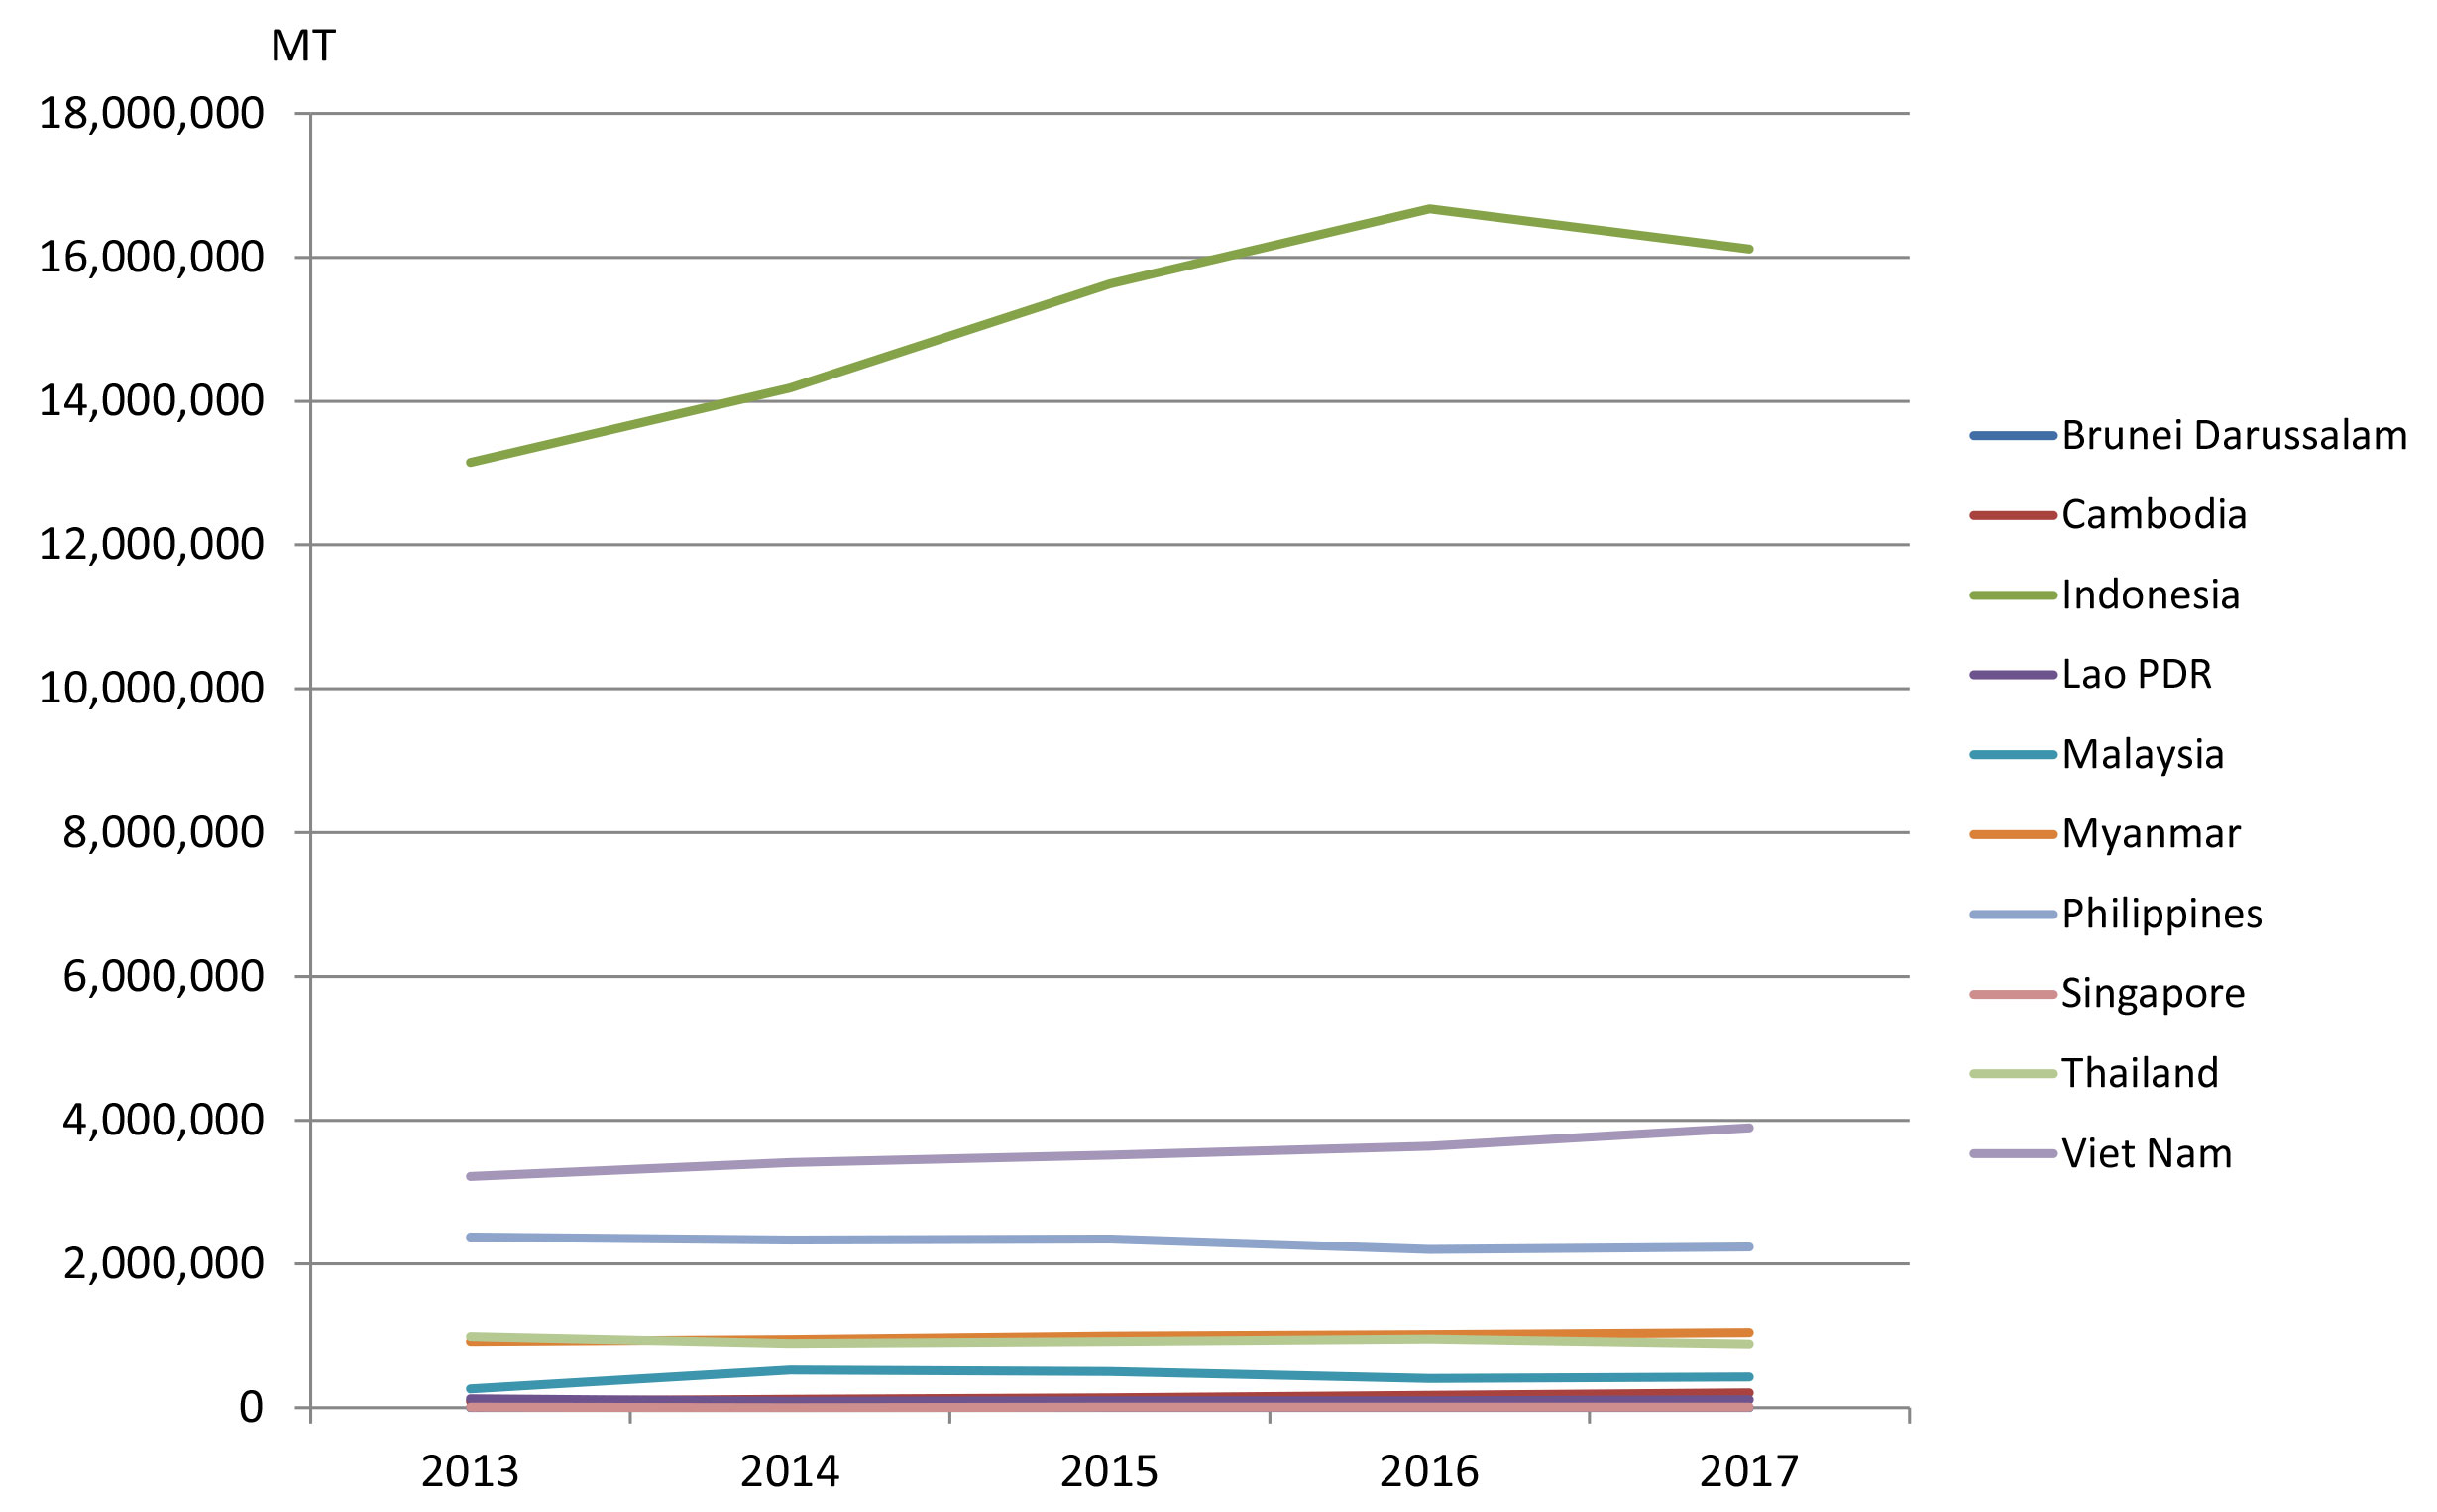
Fig. 4. Trend of the aquaculture production (MT) of the Southeast Asian countries from 2013 to 2017
In terms of value per quantity of aquaculture production in 2017, Brunei Darussalam attained the highest average value per quantity at US$ 6731/MT followed by Singapore at US$ 5719/MT, Thailand at US$ 3026/MT, Malaysia at US$ 1847MT, Myanmar at US$ 1668/MT, Philippines at US$ 894/MT, and Indonesia at US$ 866/MT. Meanwhile, the value per quantity of aquaculture production of Cambodia, Lao PDR, and Viet Nam in 2017 could not be calculated as these countries did not report their respective total production values.
Aquaculture production comes from three environments, namely: marine, brackishwater, and freshwater. In terms of quantity, aquaculture in marine areas or mariculture provided 47.0% to the region’s total aquaculture production in 2017 while brackishwater aquaculture contributed 15.0%, and the remaining 38.0% came from freshwater culture (Fig. 5). In terms of value, brackishwater aquaculture production contributed the highest at 44.0% followed by freshwater culture production at 42.0% and mariculture production at 14.0%.
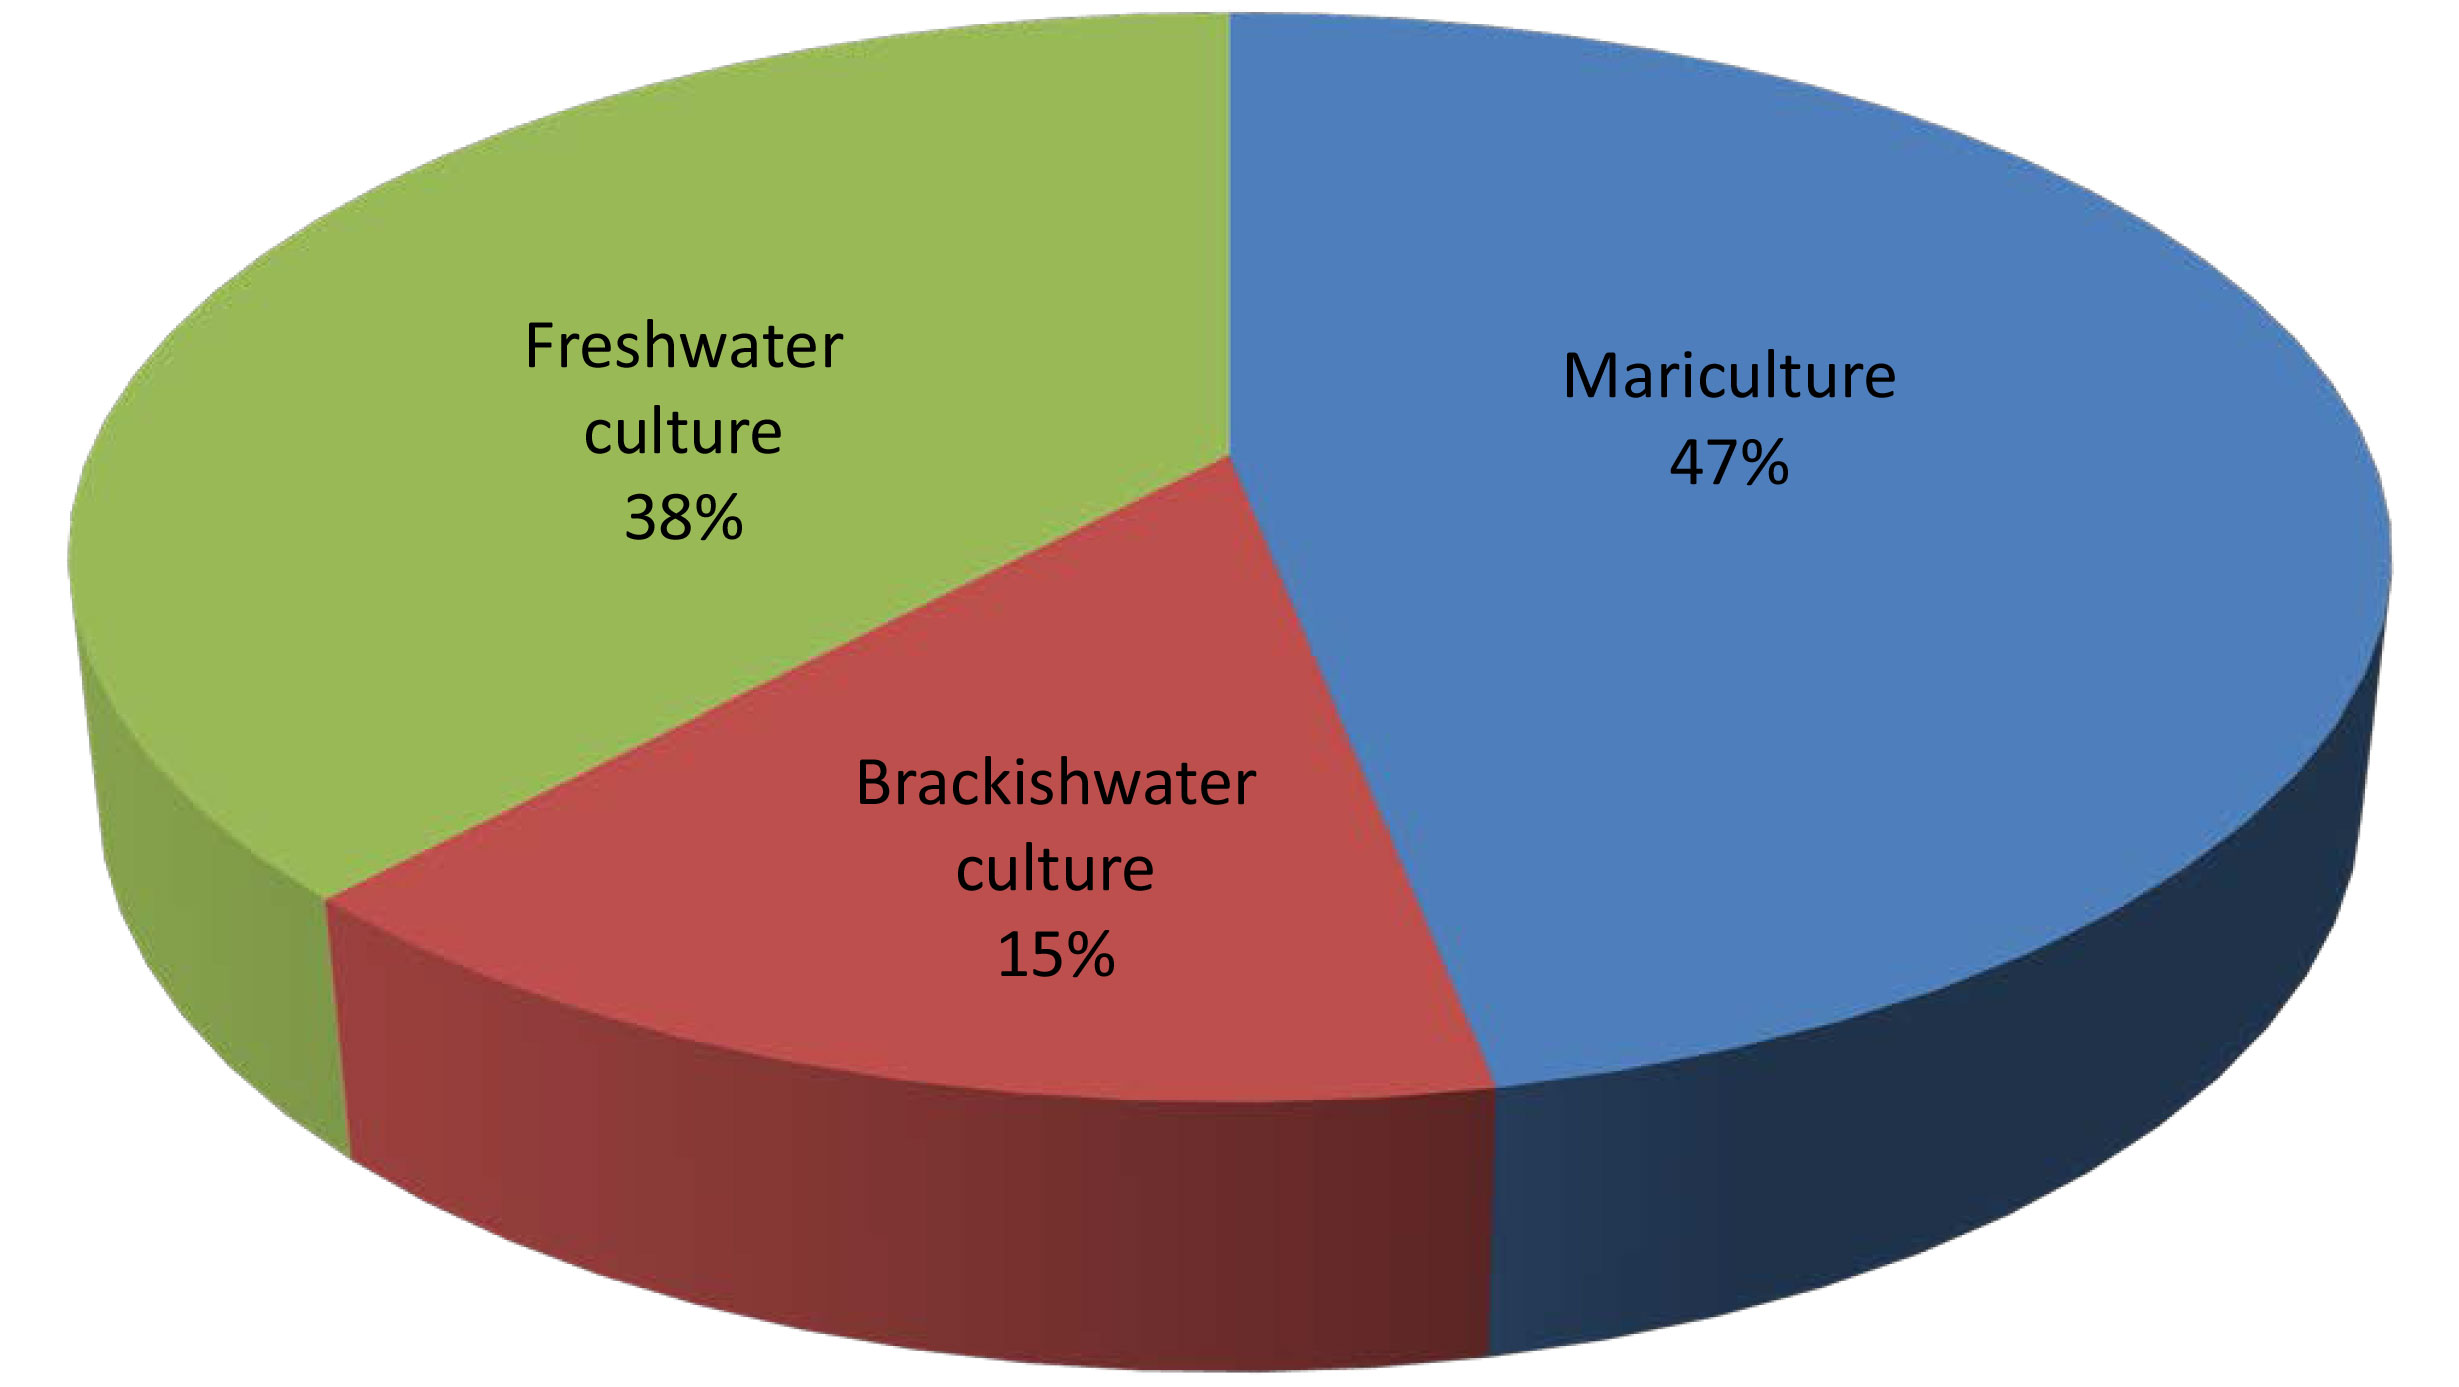
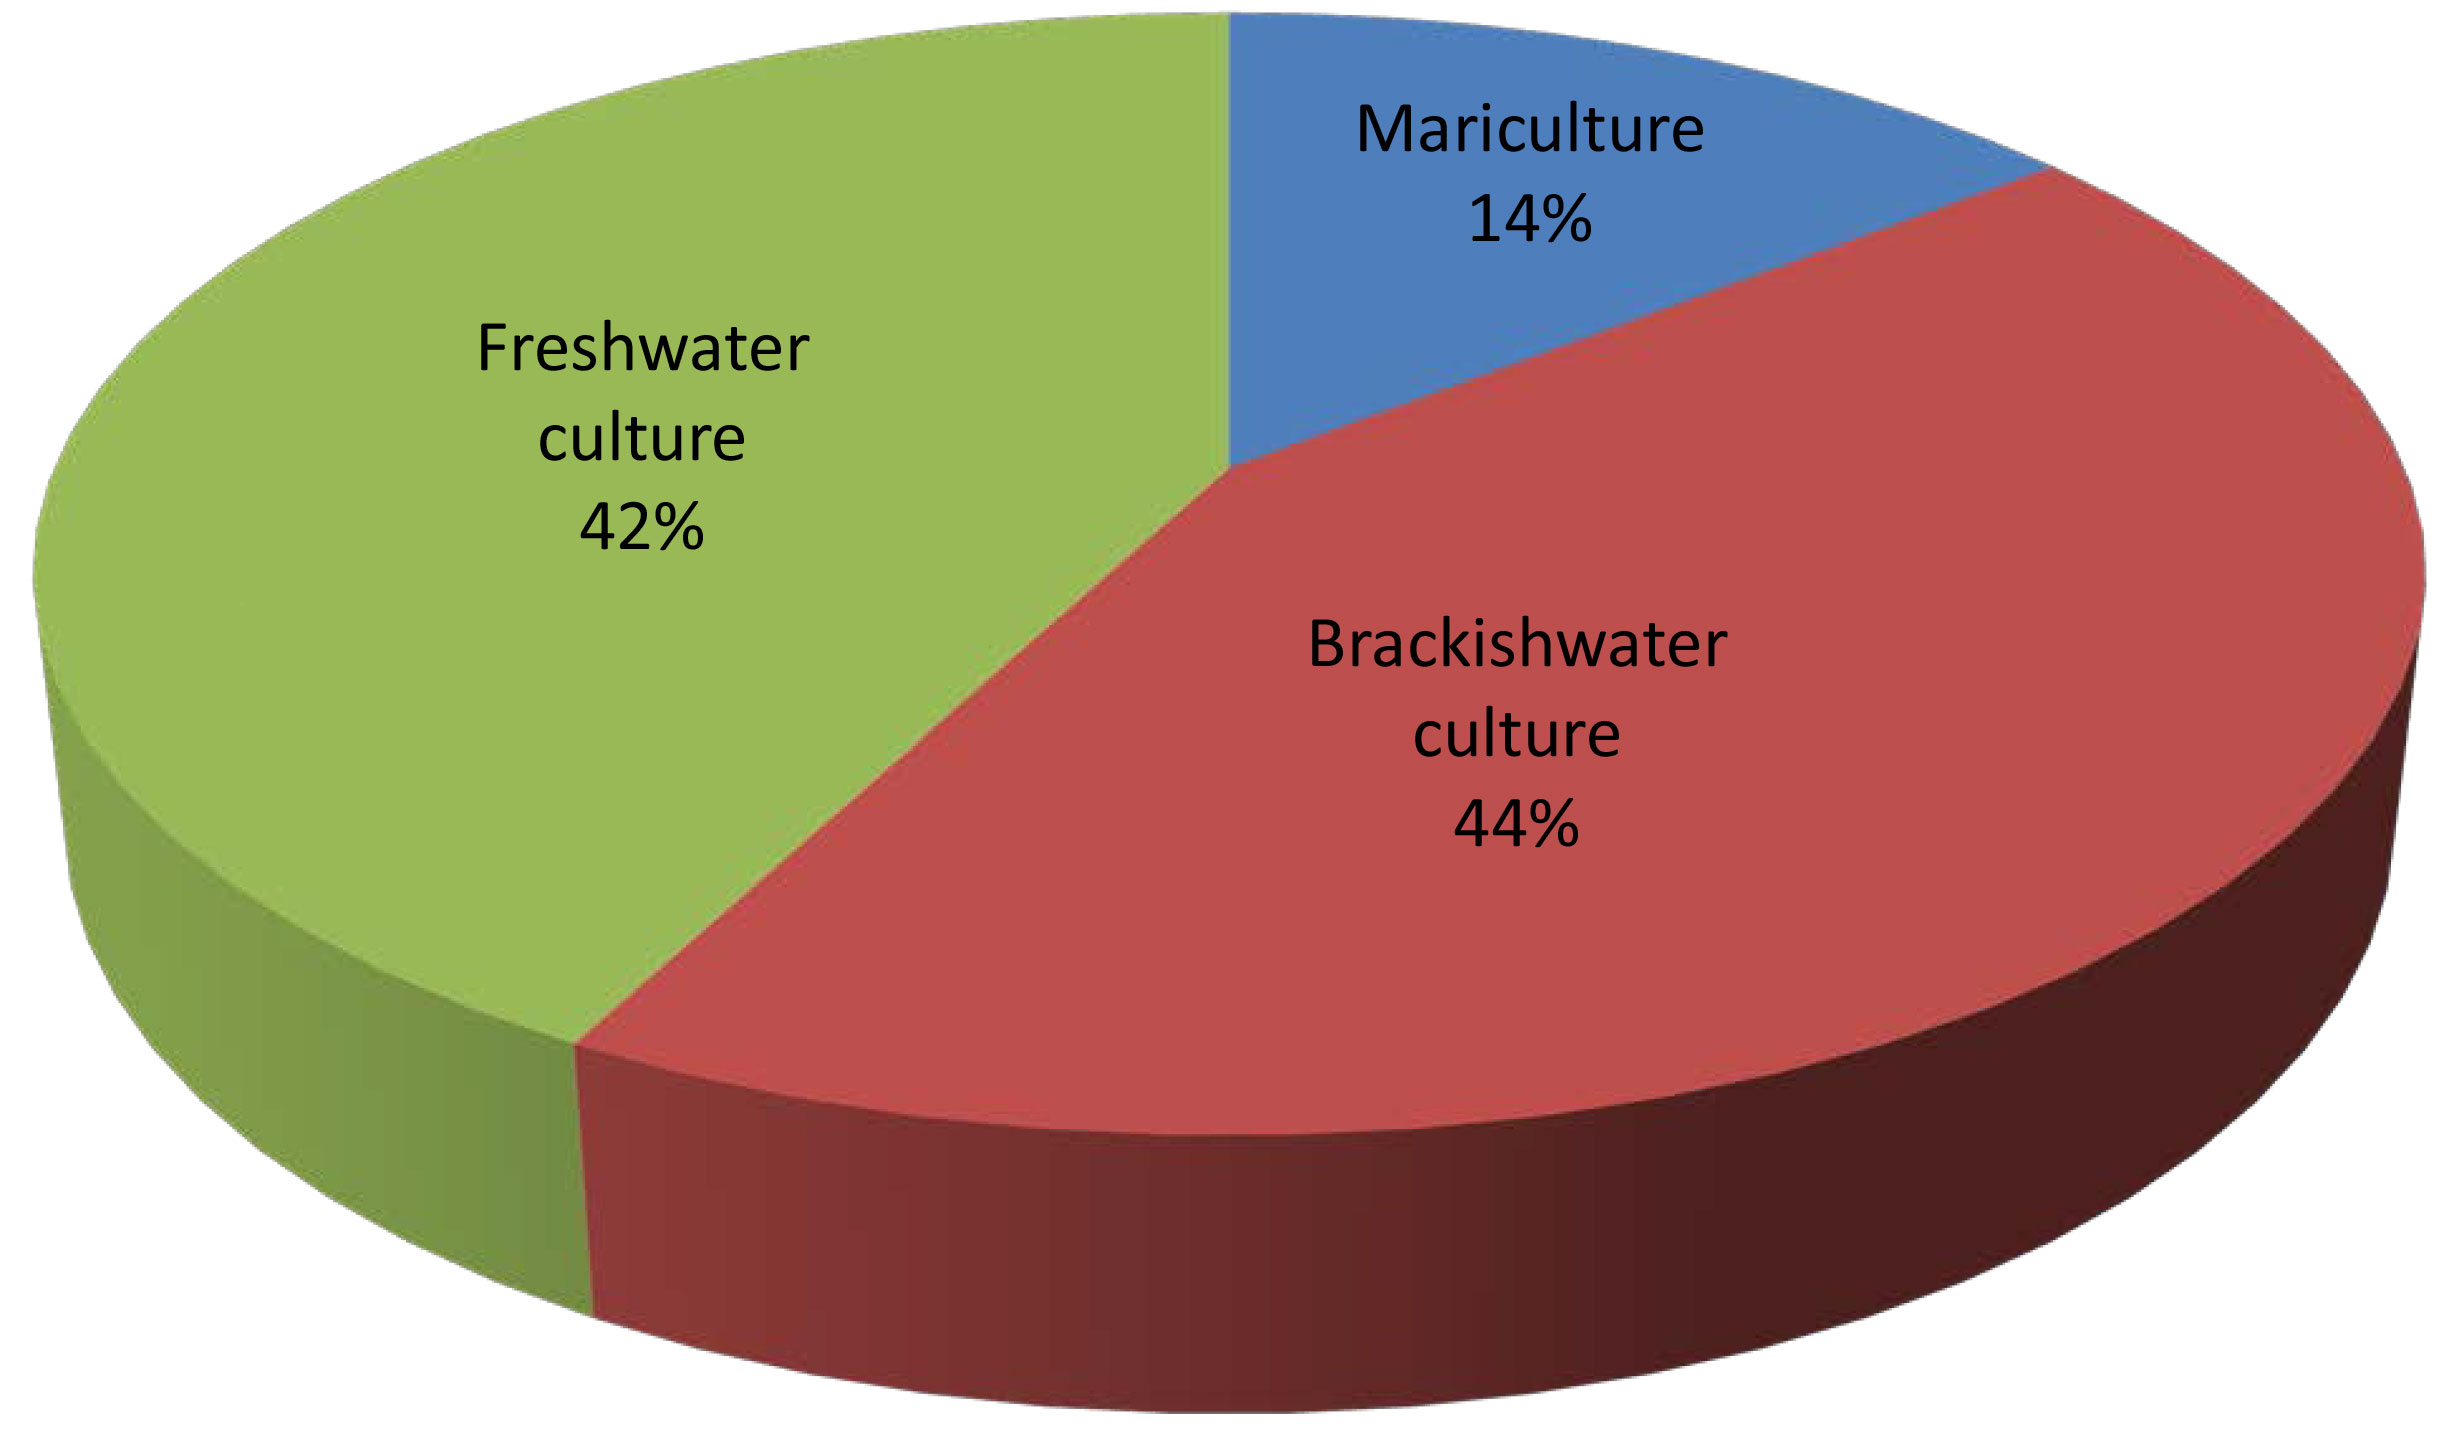
Fig. 5 Percentage of aquaculture production by sub-sector in 2017 (left by quantity: right by value)
It should be recalled that in 2016, production from mariculture accounted for 57.0% of the total aquaculture production in terms of quantity, while brackishwater culture production accounted for 9.0% and freshwater culture production at 34.0%. In terms of value, mariculture contributed 24.0% to the region’s total aquaculture production value, brackishwater culture production at 30.0%, and freshwater culture production at 46.0%. This means that in 2017, the production value from brackishwater culture increased by 78.4% from that of 2016 which could be due to the increased production of whiteleg shrimp (Penaeus vannamei) in Indonesia. While production from mariculture in 2017 compared with that of 2016 decreased by 18.2% which could be due to the decreasing value of the production of Brunei Darussalam, Malaysia, and Philippines, the region’s production value from freshwater culture increased by 11.5%.
Mariculture
In 2017, the region’s total production from mariculture contributed about 47.0% to the region’s total production in terms of quantity and 14.0% in terms of value. Farmed aquatic plants contributed 94.9% to the region’s total quantity of mariculture production, such as the spiny eucheuma (Eucheuma denticulatum), and the elkhorn sea moss (Kappaphycus alvarezii). Production of the spiny eucheuma (Eucheuma denticulatum) mainly from Indonesia accounted for 81.8% of the region’s total production quantity from mariculture, followed by the elkhorn sea moss (Kappaphycus alvarezii) the main products of the Philippines which accounted for 13.1%. Moreover, the oysters group of species mainly produced by the Indonesia, Philippines, and Thailand, contributed 0.9%; green mussels (Perna viridis) mainly produced by Thailand at 0.6%; marine fishes nei at 0.5%; shrimps mainly produced by Myanmar at 0.5%; and blood cockle (Anadara granosa) mainly produced by the Philippines and Thailand at 0.3% (Fig. 6).
In terms of value, the spiny eucheuma (Eucheuma denticulatum) contributed 32.7% to the region’s total mariculture production value followed by shrimps which contributed about 11.8%, oysters at 5.7%, elkhorn sea moss at 5.6%, marine fishes nei at 4.3%, and blood cockle accounted for 3.0% (Fig. 6). Moreover, shrimps earned the highest value per quantity at US$ 6,500/MT followed by marine fishes at US$ 2,430/ MT, and blood cockle at US$ 2400/MT. Meanwhile, the lowest value per quantity was obtained for the spiny eucheuma at US$ 104/MT (Table 9).
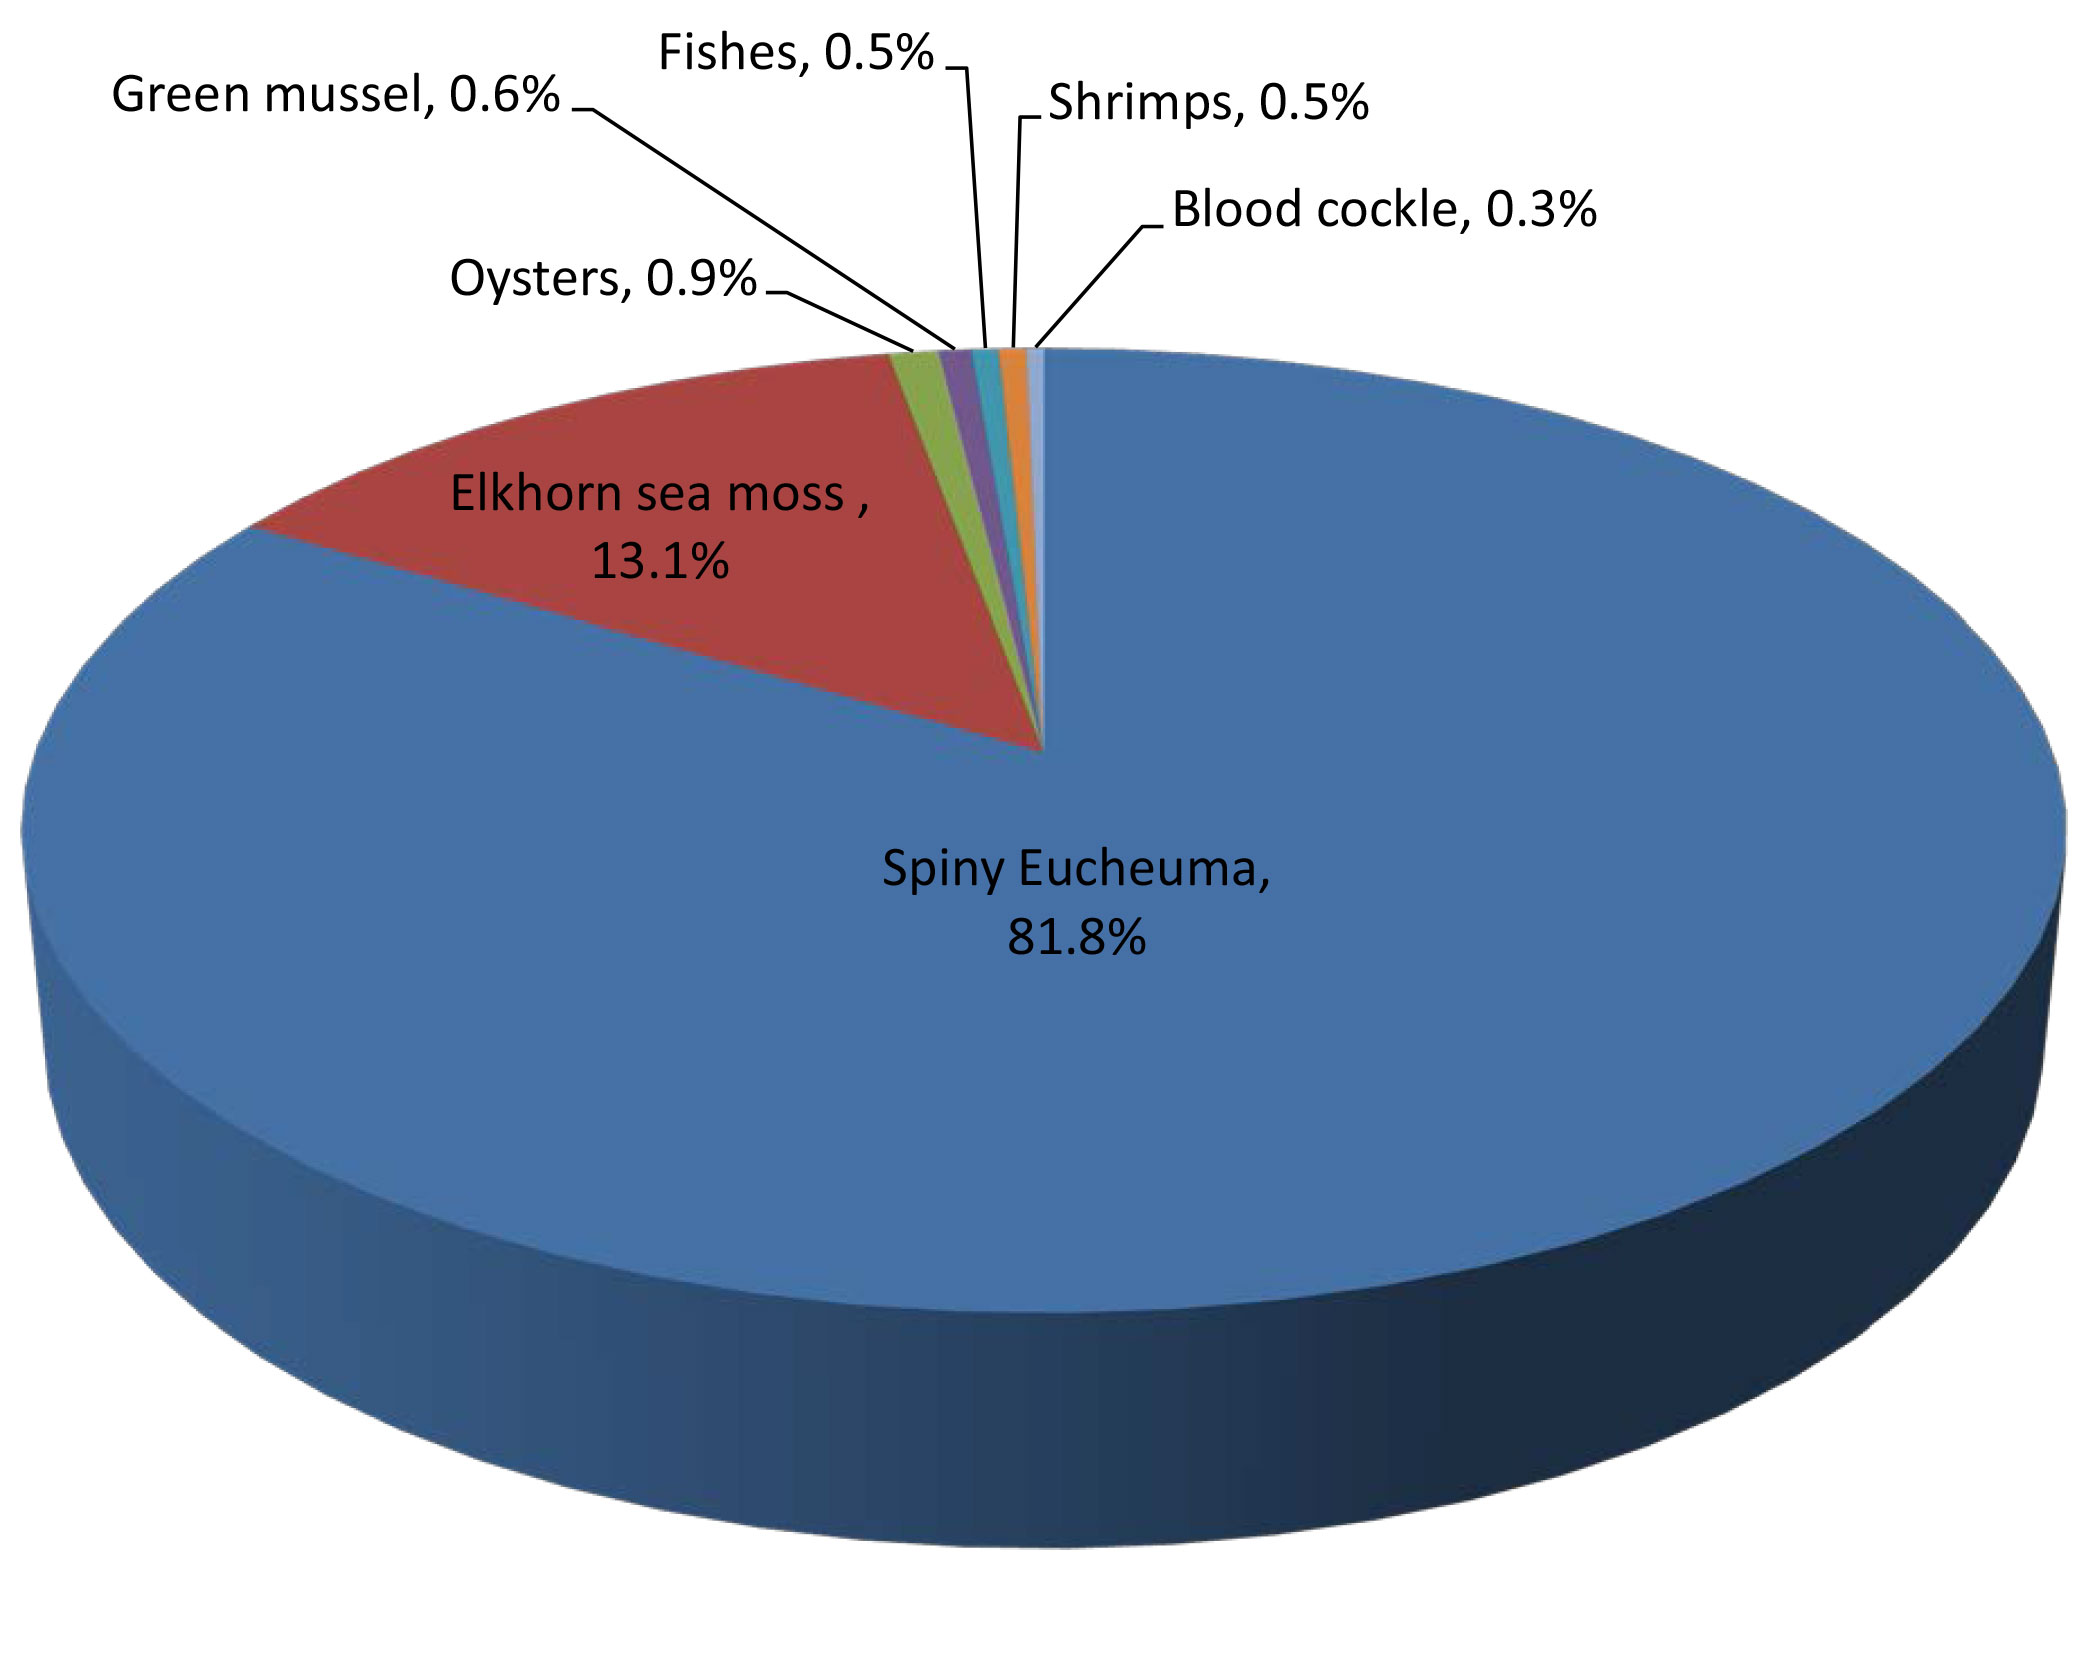

Fig. 6 Mariculture production in 2017 by major species (left by quantity; right by value)
Table 9. Major mariculture species produced in the region (as of 2017)
| Common name | Quantity (MT) |
Percentage production of major commodities from mariculture to total mariculture production (%) |
Value (US$ 1,000) |
Percentage total value of major commodities production from mariculture to total mariculture value (%) |
Price (US$/MT) |
| Spiny eucheuma | 9,572,424 | 81.8 | 995,848 | 32.7 | 104 |
| Elkhorn sea moss | 1,533,256 | 13.1 | 169,965 | 5.6 | 110 |
| Oysters | 106,499 | 0.9 | 173,808 | 5.7 | 1,632 |
| Green mussel | 72,308 | 0.6 | 29,391 | 1.0 | 406 |
| Fishes | 53,379 | 0.5 | 129,753 | 4.3 | 2,430 |
| Shrimps | 55,310 | 0.5 | 359,512 | 11.8 | 6,499 |
| Blood cockle | 38,344 | 0.5 | 92,041 | 3.0 | 2,400 |
For the value per quantity of mariculture production in 2017, Brunei Darussalam posted the highest at an average of US$ 7,194/MT from its production of the highly economical species of giant sea perch (Lates calcarifer), followed by Myanmar at US$ 6,432/MT for shrimps, and Singapore at US$ 4,656/MT for its production also of the giant sea perch (Lates calcarifer). Meanwhile, the mariculture production value of Thailand was at US$ 1,275/MT, Philippines at US$ 591/MT, Indonesia at US$ 169/MT, and Malaysia at US$ 137/MT.
Brackishwater Culture
The total production from brackishwater culture in 2017 represented about 15% of the region’s total production from aquaculture (Fig. 7). Production of whiteleg shrimps (Penaeus vannamei) mainly produced by Indonesia and Thailand had the highest quantity representing 30.7% of the region’s total production from brackishwater culture. The second highest was contributed by milkfish (Chanos chanos) at 29.7% mainly produced by Indonesia and the Philippines, and the third came from Gracilaria seaweeds (Gracilaria spp.) at 28.2% mainly contributed by Indonesia. Meanwhile, the giant tiger prawn (Penaeus monodon) contributed 5.3% mainly from Indonesia; and giant sea perch (Lates calcarifer) at 1.6% mainly contributed by Malaysia and Thailand; while the group of miscellaneous fishes (unidentified species) also contributed 2.5% . In terms of value, the whiteleg shrimp (Penaeus vannamei) had the highest, which was provided by Indonesia, Malaysia, and Thailand contributing 60.8%; followed giant tiger prawn (Penaeus monodon) by Indonesia and Thailand contributing the highest value at 14.1%; giant sea perch (Lates calcarifer) at 2.5%; and milkfish (Chanos chanos) from Indonesia and the Philippines at 1.8%; while the group of miscellaneous fishes (unidentified species) contributed 7.9% of the total value.
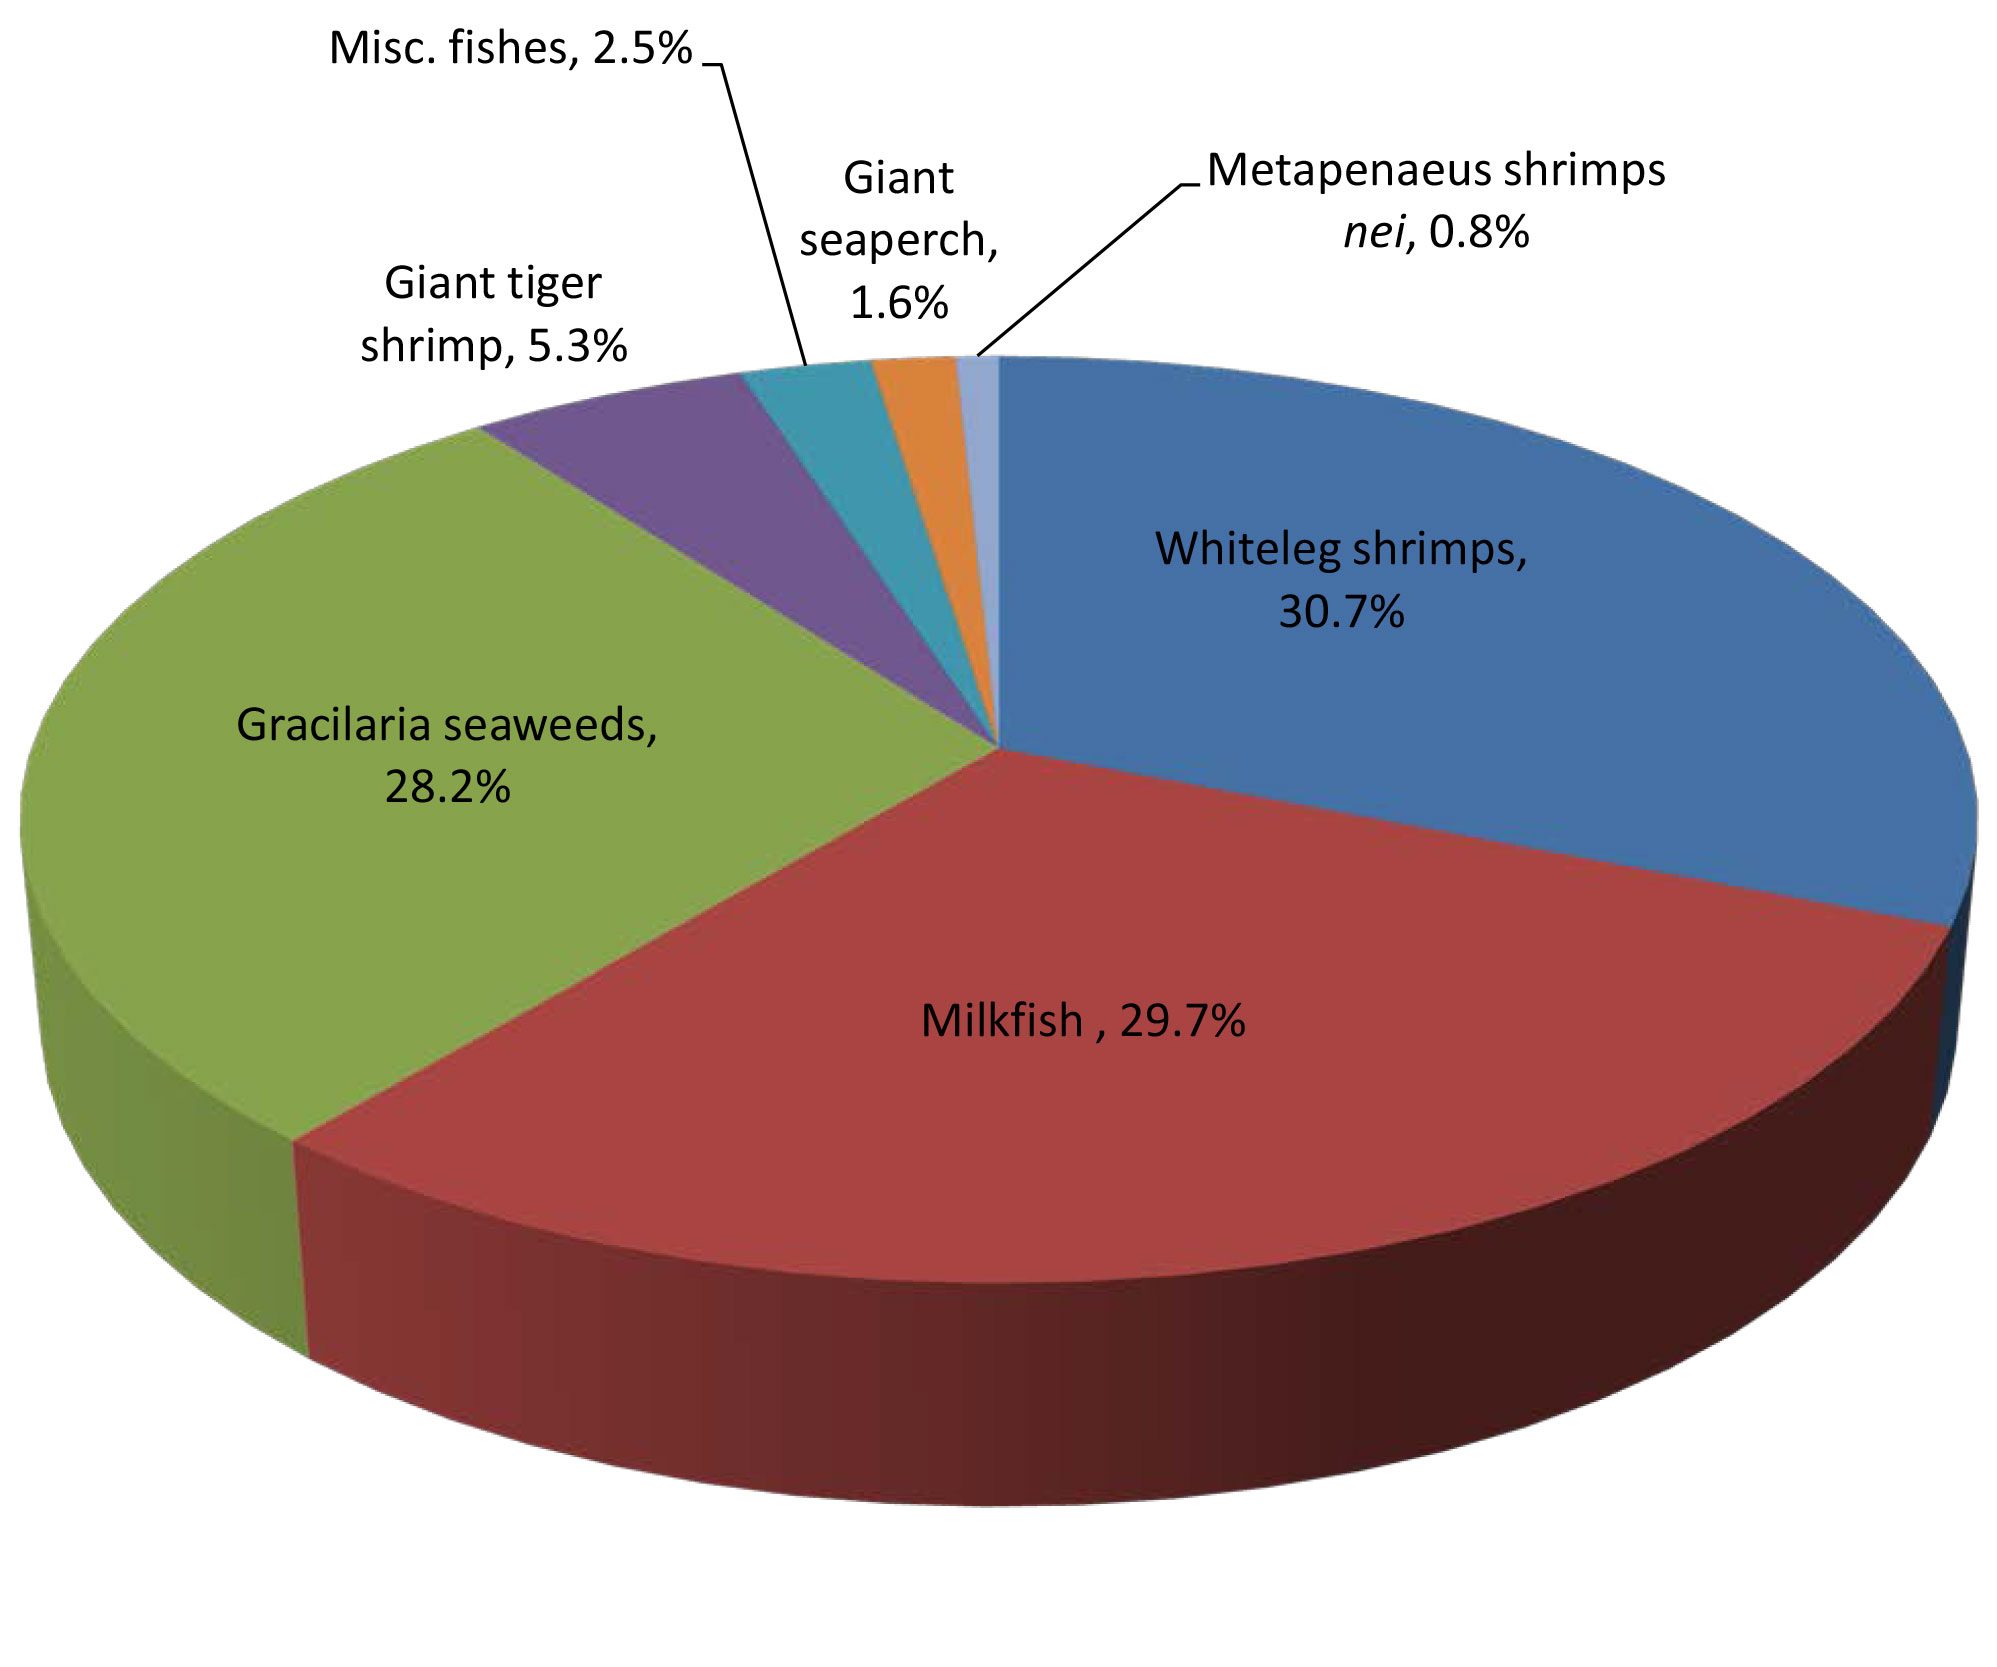

Fig. 7 Brackishwater culture production in 2017 by species (left by quantity; right by value)
Table 10. Major brackishwater species cultured in the region (as of 2017)
| Common name | Quantity (MT) |
Percentage brackishwater culture production of major commodities to total brackishwater culture production (%) |
Value (US$ 1,000)* |
Percentage total value of major commodities production from brackishwater culture to total brackishwater culture value (%) |
Price (US$/MT)** |
| Whiteleg shrimp | 1,153,741 | 30.7 | 5,605,651 | 60.8 | 4,859 |
| Milkfish | 1,114,731 | 29.7 | 168,639 | 1.8 | 151 |
| Gracilaria seaweeds | 1,059,204 | 28.2 | 86,944 | 0.9 | 82 |
| Giant tiger shrimp | 197,231 | 5.3 | 1,295,868 | 14.1 | 6,570 |
| Misc. fishes | 92,460 | 2.5 | 725,267 | 7.9 | 7,844 |
| Giant seaperch | 60,367 | 1.6 | 230,624 | 2.5 | 3,820 |
| Metapenaeus shrimps nei |
30,258 | 0.8 | 63,746 | 0.7 | 2,107 |
* Data not available from Cambodia and Viet Nam
** Computation of price excludes corresponding quantity production from Cambodia and Viet Nam
In terms of average value per quantity of production from brackishwater culture, considering only the countries that reported their respective production values, Singapore posted the highest at US$ 24,206/MT followed by Brunei Darussalam at US$ 6,572/MT, Malaysia at US$ 5,393/MT, Thailand at US$ 5,007/MT, Indonesia at US$ 2,166/MT, and the Philippines at US$ 1,444/MT. Cambodia and Viet Nam did not report their respective production from brackishwater aquaculture in terms of value. The highest value per quantity of production was attained by the marine fishes (unidentified species) at US$ 7,844/MT followed by giant tiger shrimp at US$ 6,570/MT, whiteleg shrimp at US$ 4,859/MT, giant sea perch at US$ 3,820/MT, Metapenaeus shrimps nei at US$2,107/MT, and milkfish which obtained the lowest value at US$ 151/MT (Table 10).
Freshwater Culture
The region’s total production from freshwater culture in 2017 accounted for about 38.0% of the region’s total production from aquaculture, an increase of about 11.5% from that of the production in 2016. In 2017, Indonesia was the highest producer from freshwater aquaculture contributing about 39.8% of the region’s total production from freshwater culture, followed by Viet Nam at 37.8%, Myanmar at 10.4%, Thailand at 4.4%, Philippines at 3.3%, Cambodia at 2.0%, Lao PDR at 1.2%, and Malaysia at 1.1%.
Accounting for 42.0% of the region’s total aquaculture production value in 2017, the freshwater culture sub-sector seems to have emerged as a very important fisheries sub-sector. This is considering that its production value in 2017 had increased by almost 21.3% compared with that of 2016, although this information could be underestimated due to the missing corresponding production values from Cambodia, Lao PDR, and Viet Nam.
In terms of production quantity from freshwater culture by species (Fig. 8) was reportes as 32.1% of the region’s total production from freshwater culture was reported, miscellaneous freshwater fishes (unidentified species) which was mainly contributed by Viet Nam. This was followed by Nile tilapia (Oreochromis niloticus) which accounted for 17.1% and contributed mainly by Indonesia, Thailand, and the Philippines; and the torpedo-shaped catfishes nei (Clarias spp.) followed at 12.4% which was contributed mainly by Indonesia; freshwater prawns came in next at 8.2% contributed mainly by Viet Nam; roho labeo (Labeo rohita) at 6.9% contributed mainly by Myanmar; pangas catfishes (Pangasius spp.) contributed mainly by Indonesia and Myanmar at 4.2%; common carp (Cyprinus carpio) accounted for 3.6% contributed by Indonesia; snakeheads (Channa spp.) contributed mainly by Indonesia at 3.0%; and giant gourami (Osphronemus goramy) at 2.5% mainly contributed by Indonesia.
On production value, the highest contributor to the region’s total production value from freshwater culture in 2017 was the Nile tilapia (Oreochromis niloticus) which accounted for 28.5% of the region’s total production from freshwater culture, followed by torpedo-shaped catfishes (20%), roho labeo (8.8%), common carp (7.1%), pangas catfishes at 6.8%, miscellaneous fishes at 6.7%, snakeheads nei (6.3%), giant gourami (6.1%), tilapias (2.8%), freshwater prawns (2.1%), mrigal carp (1.9%), catfishes hybrid (1.5%), and pirapatinga (red-bellied pacu, Piaractus brachypomus (Cuvier, 1818)) at 1.2%. For the value per quantity of major freshwater culture species, the highest was earned by the frehwater prawns at US$ 6,735/MT followed by giant gourami at US$ 2,328/MT, mrigal carp at US$ 2,295/MT, snakeheads at US$ 2,003/MT, common carp at US$ 1,854/MT, Nile tilapia at US$ 1,581/MT, pangas catfishes at US$ 1,537/MT, torpedo-shaped catfishes at US$ 1,523/MT, tilapias at US$ 1,400/MT, pirapatinga at US$ 1,372/MT, catfishes hybrid at US$ 1,294/MT, and roho labeo at US$ 1,200/MT (Table 11).
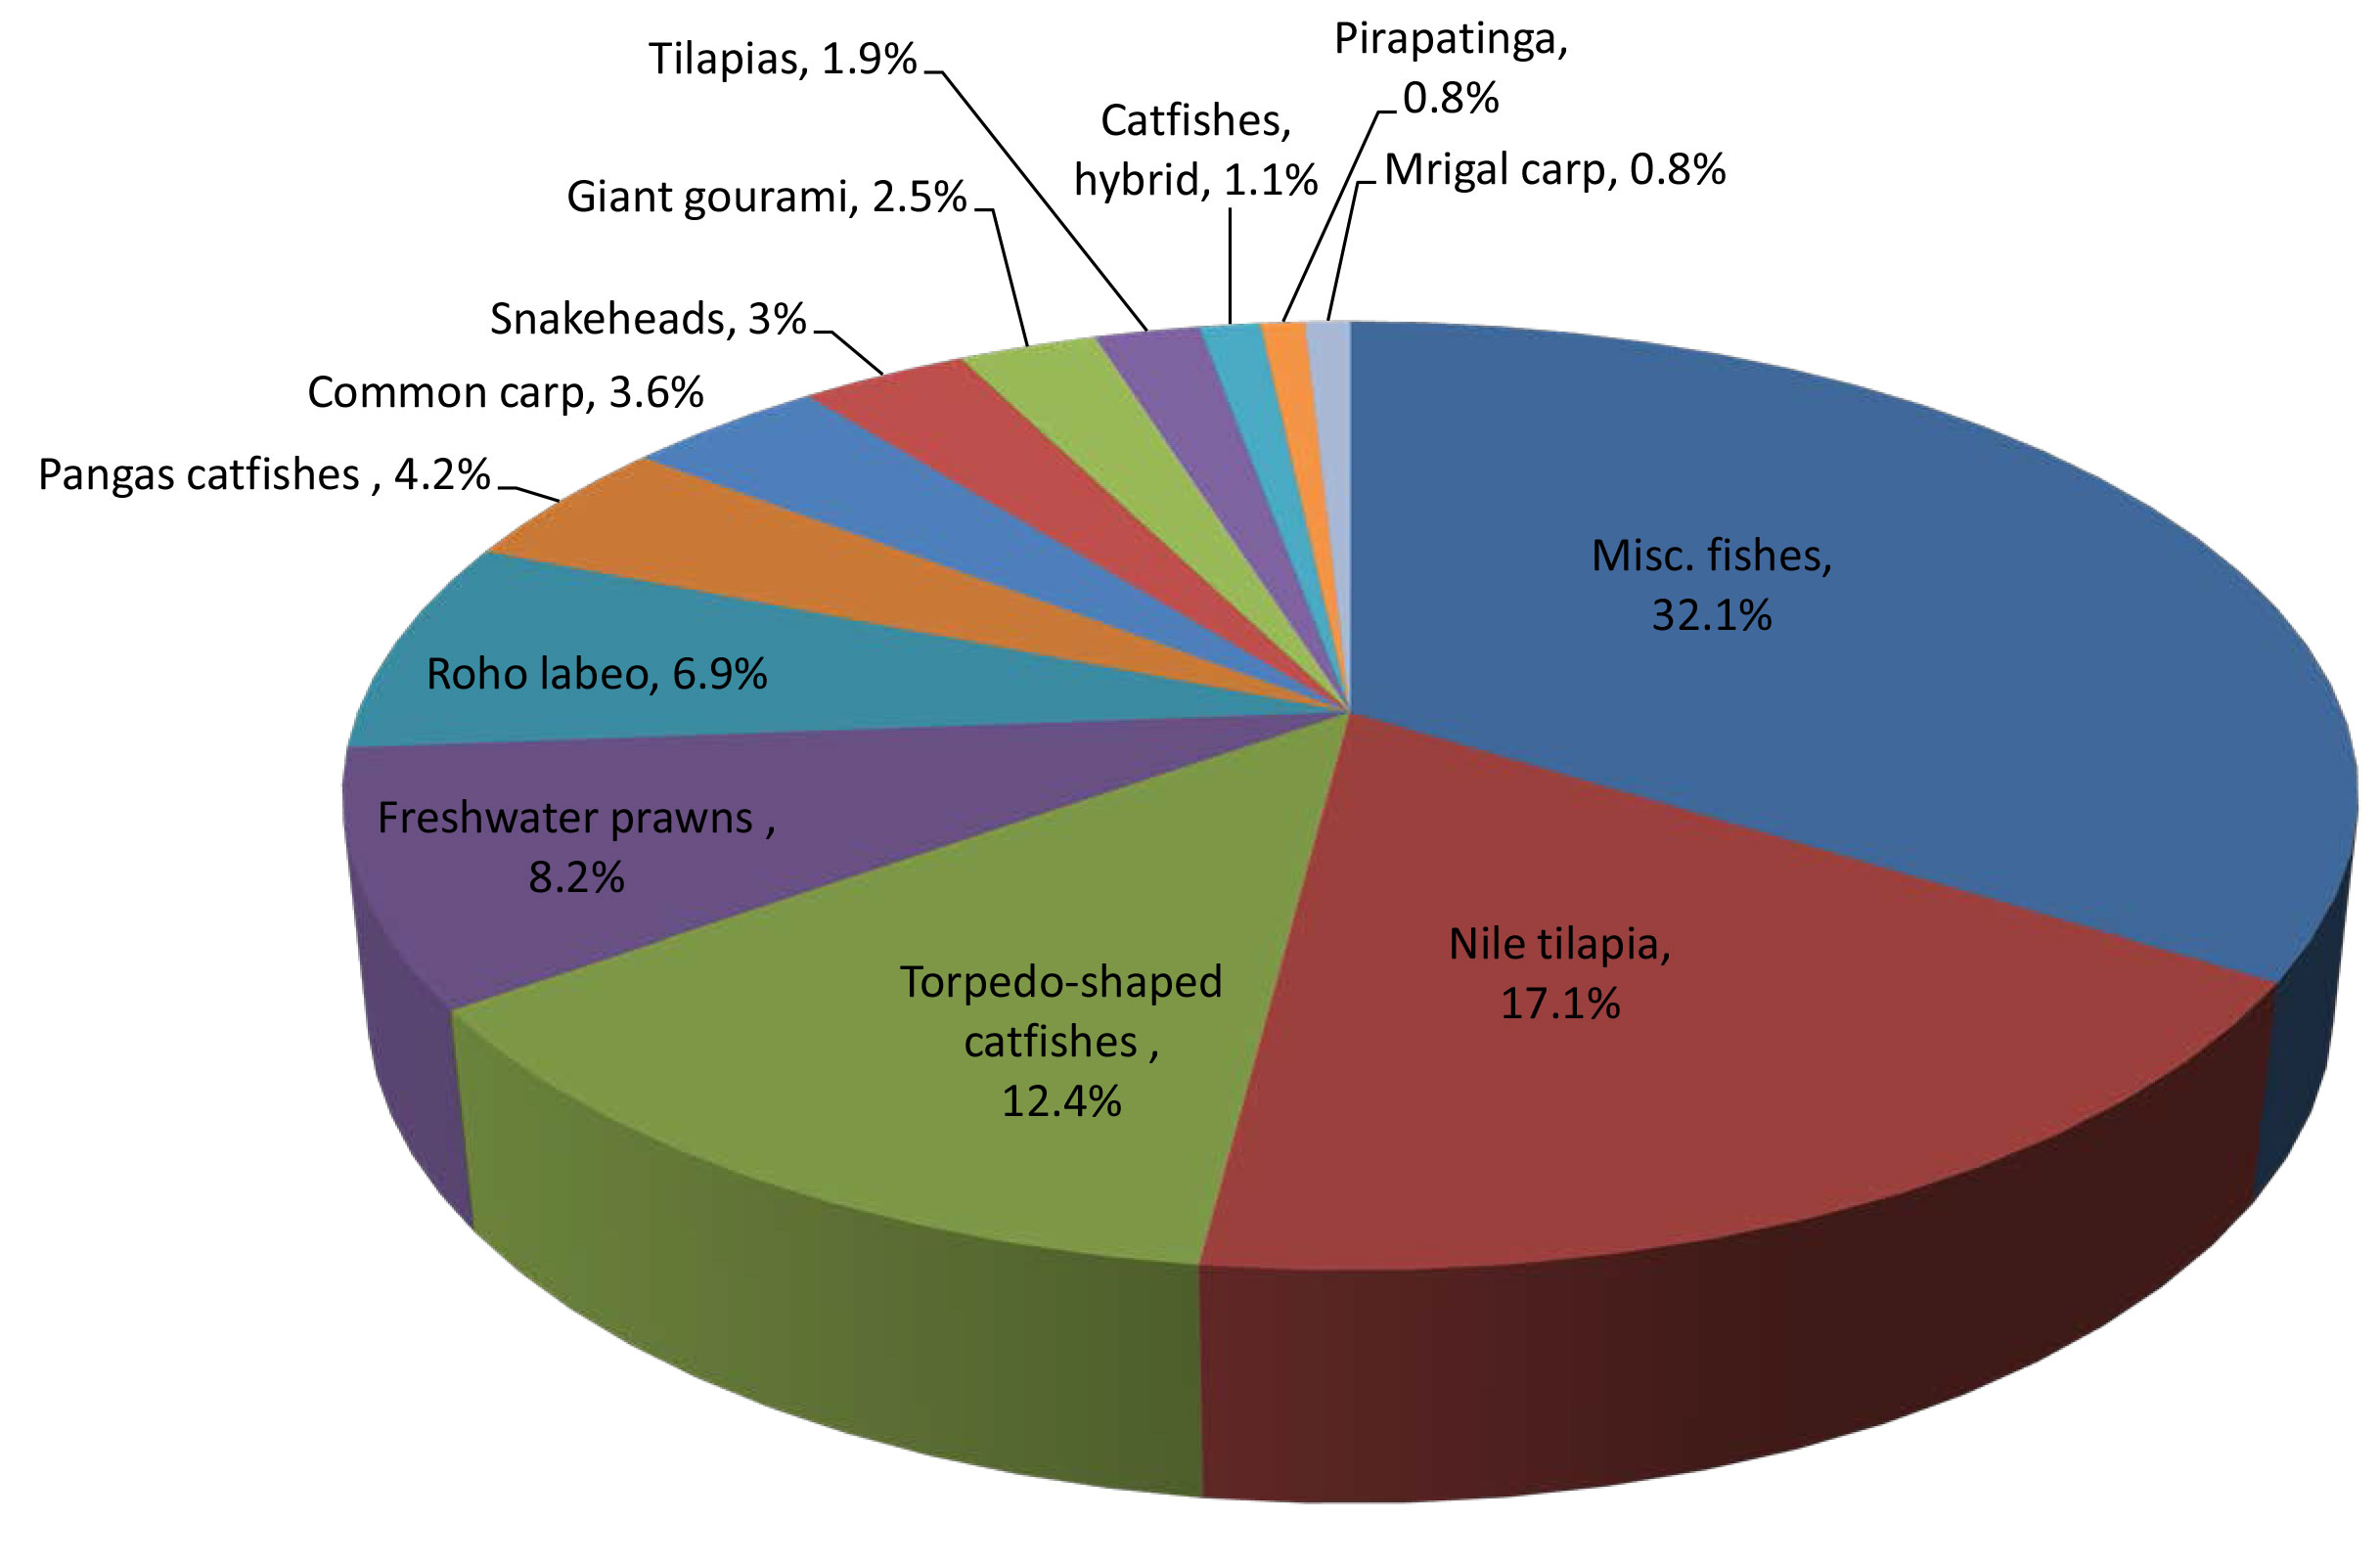
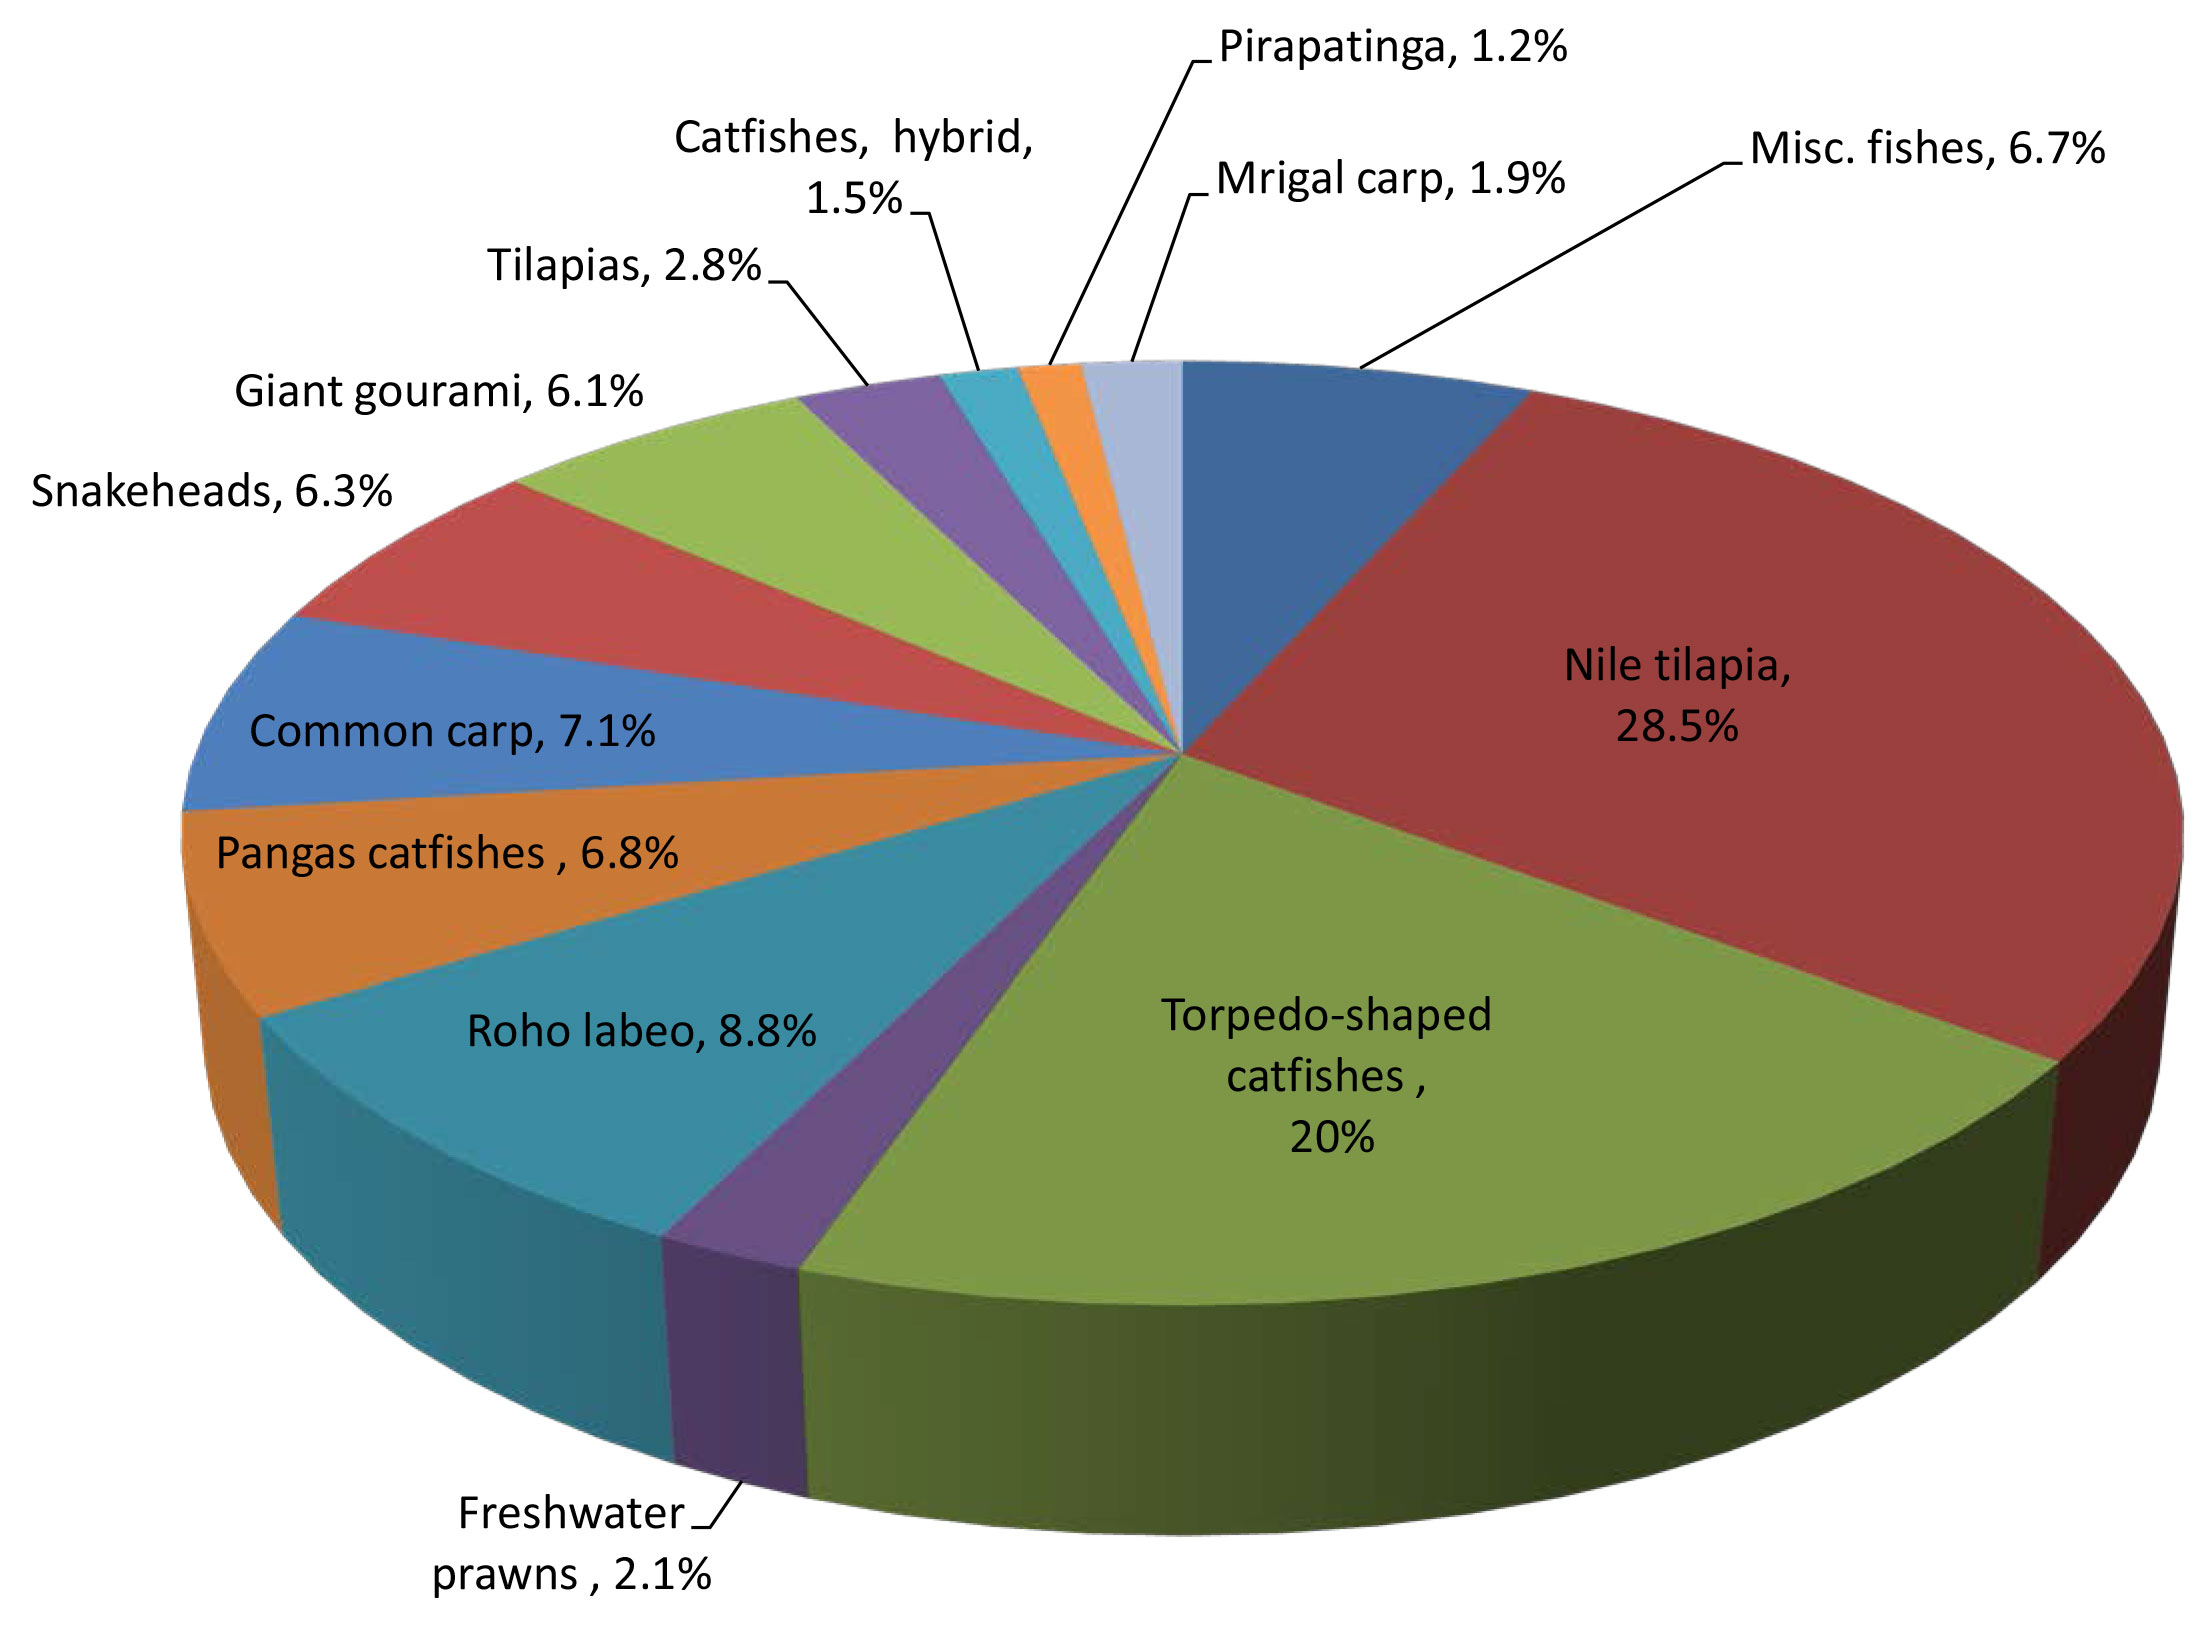
Fig. 8. Production of major freshwater culture species in 2017 (by quantity (left) and value (right))
Furthermore, for the value of production from freshwater culture by country, Brunei Darussalam presented the highest average value per quantity at US$ 8,053/MT mainly coming from its production of the Mozambique tilapia (Oreochromis mossambicus). This was followed by Singapore at US$ 7,427/MT mainly for its production also of the Mozambique tilapia (O. mossambicus), Malaysia at US$ 1,863/MT also for its production of torpedo-shaped catfishes nei, Indonesia at US$ 1,669/MT, Thailand at US$ 1,609/MT, the Philippines at US$ 1,482/MT, and Myanmar at US$ 1,384/MT.
Table 11. Major freshwater species cultured in the region (as of 2017)
| Common name | Quantity (MT) |
Percentage freshwater culture production of major commodities to total freshwater culture production (%) |
Value (US$ 1,000)* |
Percentage total value of major commodities production from freshwater culture to total freshwater culture value (%) |
Price (US$/MT)** |
| Misc. fishes | 3,044,652 | 32.1 | 23,121 | 6.7 | 1,208 |
| Nile tilapia | 1,623,391 | 17.1 | 2,566,751 | 28.5 | 1,581 |
| Torpedo-shaped catfishes |
1,179,056 | 12.4 | 1,795,940 | 20.0 | 1,523 |
| Freshwater prawns |
773,395 | 8.2 | 189,577 | 2.1 | 6,735 |
| Roho labeo | 656,609 | 6.9 | 788,529 | 8.8 | 1,200 |
| Pangas catfishes | 396,251 | 4.2 | 609,358 | 6.8 | 1,537 |
| Common carp | 342,461 | 3.6 | 635,118 | 7.1 | 1,854 |
| Snakeheads | 283,439 | 3.0 | 567,749 | 6.3 | 2,003 |
| Giant gourami | 236,126 | 2.5 | 549,744 | 6.1 | 2,328 |
| Tilapias | 180,383 | 1.9 | 252,681 | 2.8 | 1,400 |
| Catfishes, hybrid | 105,144 | 1.1 | 136,061 | 1.5 | 1,294 |
| Pirapatinga | 78,1783 | 0.8 | 107,313 | 1.2 | 1,372 |
| Migral carp | 72,662 | 0.8 | 166,807 | 1.9 | 2,295 |
* Data not available from Cambodia, Lao PDR, and Viet Nam
** Computation of price excludes corresponding quantity production from Cambodia, Lao PDR, and Viet Nam
Fishing Gear Analysis
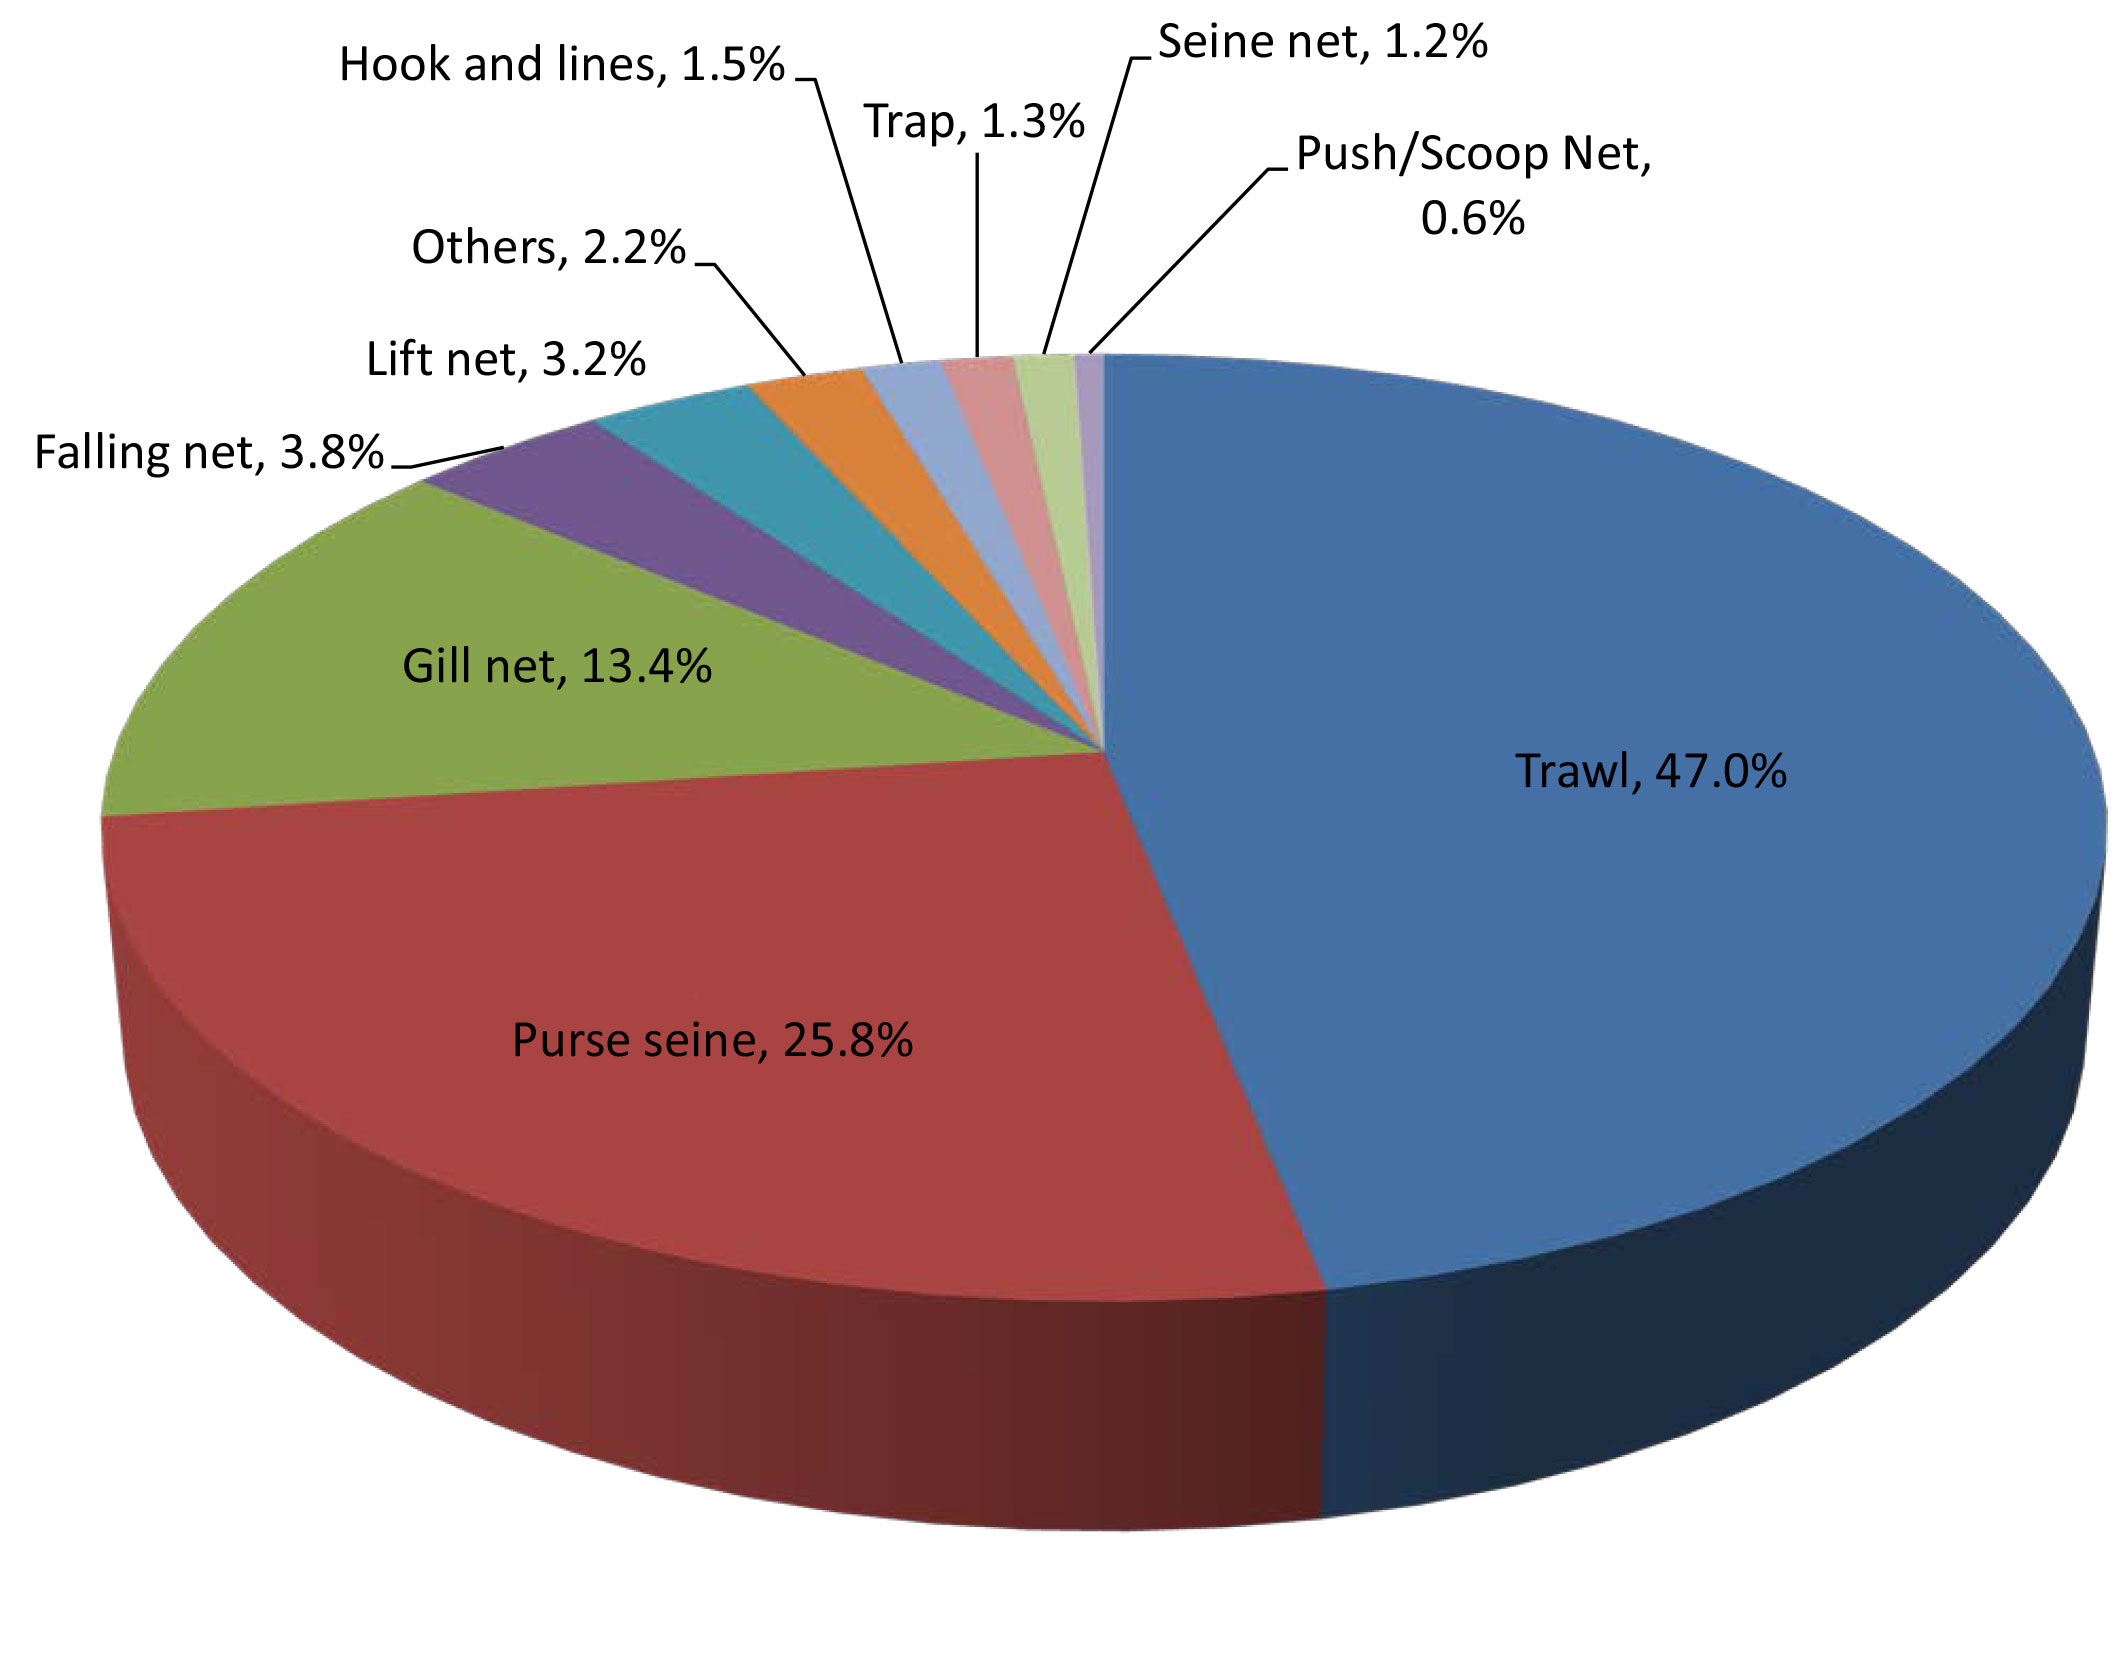
Fig. 9. Marine capture fishery production by type of gear used in 2017
From such information, the highest production by type of gears in Brunei Darussalam was from gill nets which accounted for about 60.1% of the total production of all types of gears, with banana prawn (Penaeus merguiensis) and yellowtail scad (Atule mate) as the main catch. This was followed by hook and lines at 12.5% catching yellowtail scad (Atule mate), trawl at 11.6% catching threadifn breams nei (Nemipterus spp.) as the main catch that comprised almost all of the commodities produced.
For Malaysia, trawls were very prominent with total catch that accounted for 48.6% of the country’s production from all types of gears, of which trash fishes comprised 30.4% of the trawl’s total production. This was followed by purse seines contributing about 20.6% to the total production from all types of gears, where scads nei (Decapterus spp.) comprised 23.1% of the total production from purse seines. Gill net came third contributing 19.5% to the production from all types of gears, where the Indian mackerels (Rastrelliger spp.) accounted for about 25.0% of the total production from gill nets.
For Thailand, trawls gave the highest production by type of gears for about 30.9% producing mainly trash fishes that represented about 42.0%, marine fishes (unidentified species) about 9.5%, common squids (Loligo spp.) about 7.1%, and threadfin breams (Nemipterus spp.) about 4.5%. Purse seines came in second contributing 31.0% to the production from all types of gears catching jacks, crevalles nei (Caranx spp.) representing about 14.6%, scads nei (Decapterus spp.) about 12.7%, Sardinellas nei (Sardinella spp.) about 12.5%, and the Stolephorus anchovies (Stolephorus spp.) about 11.7%.
In the case of Singapore, trawls gave the highest production by type of gears for nearly 100.0% with penaeid shrimps (Penaeus spp.) accounting for about 19.9%, stingrays (Dasyatis spp.) about 5.6%, sea catfishes about 4.9%, croakers (Pennahia spp.)about 4.7%.
Number of Fishing Boats by Type
Number of Fishers by Working Status
Fig 10. Number of fishers by working status in 2017
Efforts to improve data availability and statistics in support of all efforts to compile the data and information should therefore be intensified by encouraging the countries to enhance the reporting of fishers and fish farmers engaged in small-scale fisheries operations through the conduct of census and surveys using questionnaires. This would enable the countries to compile the necessary data and information on fisheries including the number of fishers and fish farmers as well as on the number of fishing vessels and gear used.
Aquaculture Production of Ornamental Fishes
In terms of value, the highest was posted by the cichlid (Cichlosoma spp.) at US$ 7.6/pc followed by tricolor sharkminnow (Balantiocheilos malanopterus) at US$ 3.5/pc, Siamese fighting fish (Betta splendens) at US$ 1.4/pc, bumblebee cichlid (Pseudotropheus crabro) at US$ 0.5/pc, and neon tetra (Paracheirodon innesi) at US$ 0.5/pc. Malaysia reported that the highest value that the country obtained was for the osteoglossids at US$ 26.6/pc, followed by cypinodontids at US$ 1.4/pc, chichlids at US$ 0.4/pc, anabantids at US$ 0.3/ pc, and cyprinidaes at US$ 0.3/pc. In order to have a better picture of the ornamental fish culture industry in Southeast Asia, efforts will be made to improve the compilation of data from this sub-sector considering that this is a budding industry in the region.
Seed Production for Aquaculture
Analysis of Producer Price of Commodities From Capture Fisheries
Meanwhile, the producer price situation in 2017 for certain economically important species of Southeast Asia shows that for inland fish species, the producer price of common carp (Cyprinus carpio), in Malaysia was recorded at US$ 1.93/kg while it was US$ 0.43/kg in Myanmar. For the Nile tilapia (Oreochromis niloticus), the producer price in Brunei Darussalam was US$ 4.74/kg compared to Thailand’s US$ 1.47/kg. For torpedo-shaped catfishes nei (Clarias spp.) was US$ 4.38/kg compared to Myanmar’s US$ 0.46/kg. For freshwater prawns (Palaemonidae), the producer price in Thailand was quite high at US$ 26.52/kg.
For marine fish species, the producer price of milkfish (Chanos chanos) in Brunei Darussalam was US$ 5.84/kg compared to Indonesia’s US$ 1.27/kg. Barramundi or giant sea perch (Lates calcarifer) in Brunei Darussalam and Singapore were US$ 7.30/kg and US$ 7.28/kg, respectively, compared to Myanmar’s US$ 0.33/kg. Grouper nei, Epinephelus spp. in Thailand cost US$ 10.61/kg compared to US$ 4.25/kg in the Philippines, while threadfins and tasselfishes nei (Polynemidae), the producer price in Singapore was US$ 15.64/kg compared to US$ 3.54/kg in Thailand. Likewise, for silver pomfret (Pampus argenteus), the producer price in Thailand was quite high at US$ 17.68/kg.
The producer price of the jacks, crevalles nei (Caranx spp.) in Brunei Darussalam was highest at US$ 7.30/ kg while the lowest was in the Philippines at US$ 2.31/kg. For the Indian mackerel nei (Rastrelliger spp.), the producer price in Singapore was US$ 4.15/kg while the lowest price was US$ 2.24/kg in Thailand or an average price of US$ 3.19/kg.
For the western king prawn (Penaeus latisulcatus), the highest producer price was in Thailand at US$ 7.37/kg while the lowest was US$ 1.66/kg in Malaysia. For the Indo-Pacific swamp crab (Scylla serrata), the highest price was in Singapore at US$ 11.46/kg and the lowest was in Malaysia at US$ 4.21/kg for an average of US$ 7.68/kg. As could be gleaned from the abovementioned information, the trends of the producer prices of the same commodities from among the countries in the region had generally wide variations.