 SEAFDEC Southeast Asian Fisheries Development Center
OVERVIEW OF THE FISHERIES SECTOR OF SOUTHEAST ASIA IN 2016
Fish and fishery products are becoming more increasingly important as primary sources of protein for many peoples in the world, most especially for those in the Southeast Asian region. During the past decade, the region’s product on from capture fisheries and aquaculture has been considerably increasing, and recently, many Southeast Asian countries are among the highest producers of fish and fishery products in the world. This publication is therefore intended to provide the readers with a glimpse of the increasing contribution of Southeast Asia’s fishery and aquaculture production to the world’s food fish basket. Based on the data and statistics provided by the Southeast Asian countries, SEAFDEC compiled and analyzed the necessary
information that went into this publication. Of the 11 countries that comprise the Southeast Asian region, namely: Brunei Darussalam, Cambodia, Indonesia, Lao PDR, Malaysia, Myanmar, Philippines, Singapore, Timor-Leste, Thailand, and Viet Nam, only ten countries are covered with this publication in view of the unavailability of fishery statistics and information from Timor-Leste.
Total Fishery Production of Southeast Asia 2016
towards sustainability.
Table 1. Fishery production by continent from 2012 to 2016 (million MT)
| 2012 | 2013 | 2014 | 2015 | 2016 | |
| World* | 180.7 | 188.9 | 193.4 | 199.2 | 202.2 |
| Africa | 10.1 | 10.1 | 10.5 | 10.8 | 11.4 |
| America | 21.9 | 22.4 | 20.8 | 21.3 | 20.0 |
| Asia** | 93.1 | 100.3 | 103.7 | 104.7 | 106.9 |
| Southeast Asia*** | 39.5 | 40.1 | 42.1 | 44.0 | 45.3 |
| Europe | 16.1 | 16.5 | 16.9 | 17.3 | 16.9 |
| Oceania | 1.5 | 1.4 | 1.5 | 1.6 | 1.7 |
* Source of main data: FAO FIGIS Time Series Query on Fishery Statistical Production
**Excludes Southeast Asia
***Source: Fishery Statistical Bulletin of Southeast Asia (SEAFDEC, 2018)
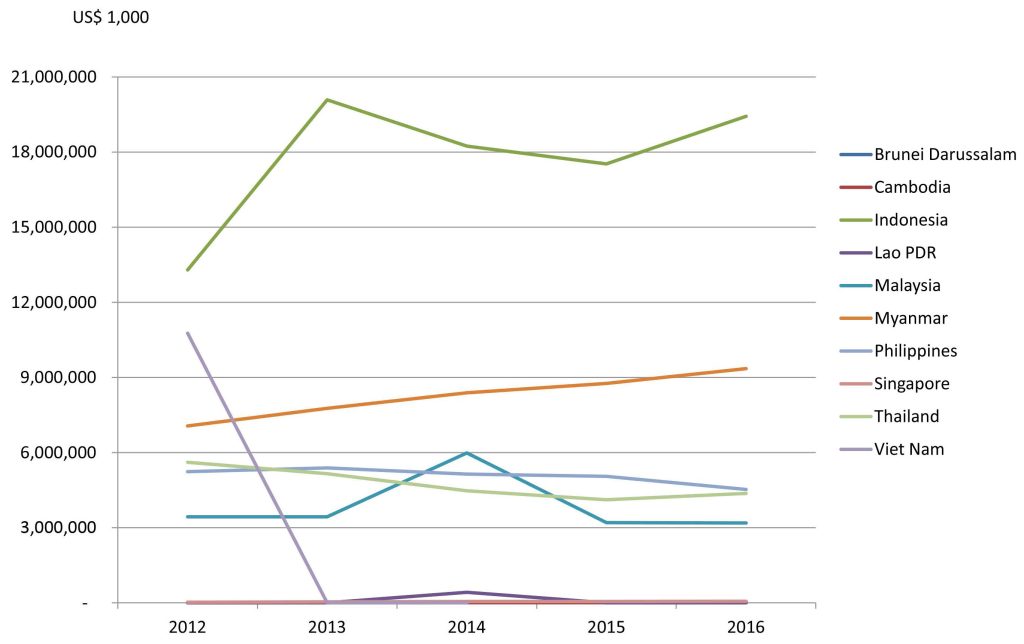
Table 2 shows that the fishery production of Southeast Asia from 2012 to 2016 exhibited a continuously increasing trend especially in terms of volume although the increases were quite unstable in terms of value. The annual average increase in volume from 2012 to 2016 was 3.5%, an annual average rate of increase in term of value was about 5.8%. However, some countries were not able to provide the value of their respective fishery production for 2016, for example Viet Nam, Cambodia, and Lao PDR. Nevertheless, the figures still imply that in addition to the increasing volume, most of the fishery commodities harvested in the region were of high value. By country, Indonesia reported the highest fishery production in 2016 in
terms of volume accounting for about 51.1% of the total fishery production of Southeast Asia, followed by Viet Nam contributing about 15.0% and Myanmar at 12.3%. The Philippines ranked next accounting for 9.6%, Thailand at 5.4%, Malaysia at 4.4%, and Cambodia at 1.8%. Lao PDR, Brunei Darussalam and Singapore contributed the least volume to the fishery production of Southeast Asia in 2016.
In terms of value, Indonesia accounted for about 47.4% of the total value of the region’s fishery production with Myanmar emerging second contributing about 22.8%, and the Philippines came in third contributing about 11.0%. Meanwhile, Thailand which came in fourth in terms of volume and value, contributed about 10.7%, and Malaysia which ranked fish in terms of production volume as well as value accounted for 7.8%. The trend of the fishery production of the Southeast Asian countries in 2012-2016 is shown in Fig. 1.a and 1.b The drastic drop in the value of fishery production from Viet Nam was not due to very low or no value, but because of the inability of the country to provide the necessary information on time.
Table 2. Total fishery production of Southeast Asia by quantity and value (2012-2016)
| Fishery Production |
2012 | 2013 | 2014 | 2015 | 2016 |
| Quantity (MT) |
39,491,091 | 40,150,808 | 42,117,647 | 43,998,242 | 45,336,312 |
| Value (US$ 1,000) |
45,457,879* | 41,892,690** | 42,722,414*** | 38,746,241** | 40,973,100** |
* Data not available from Cambodia and Lao PDR
** Data not available from Cambodia, Lao PDR and Viet Nam
*** Data not available from Cambodia and Viet Nam
Fig. 1.a Fishery production of the Southeast Asian countries in 2011-2015 by quantity
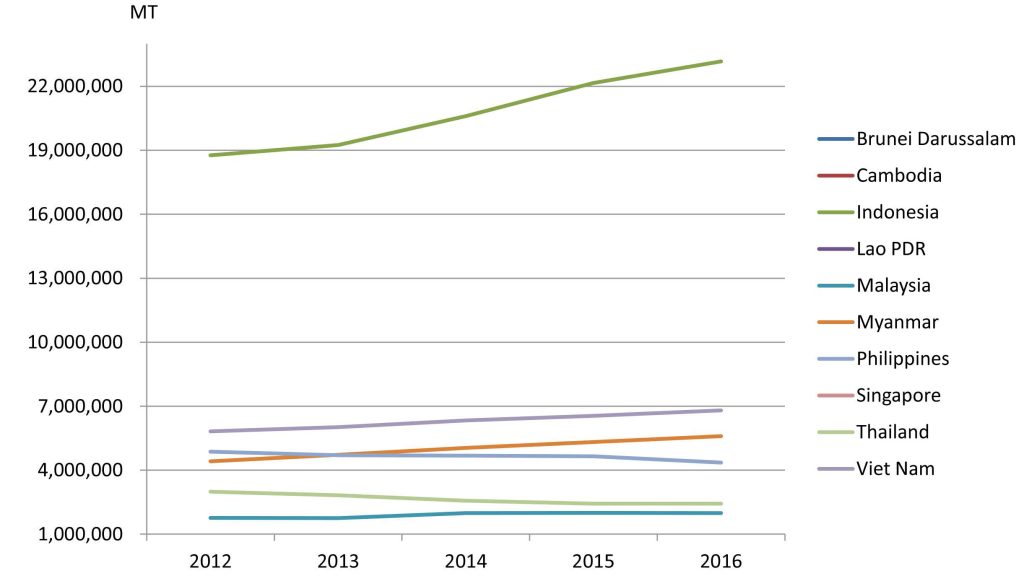
Fig. 1.b Fishery production of the Southeast Asian countries in 2012-2016 by value
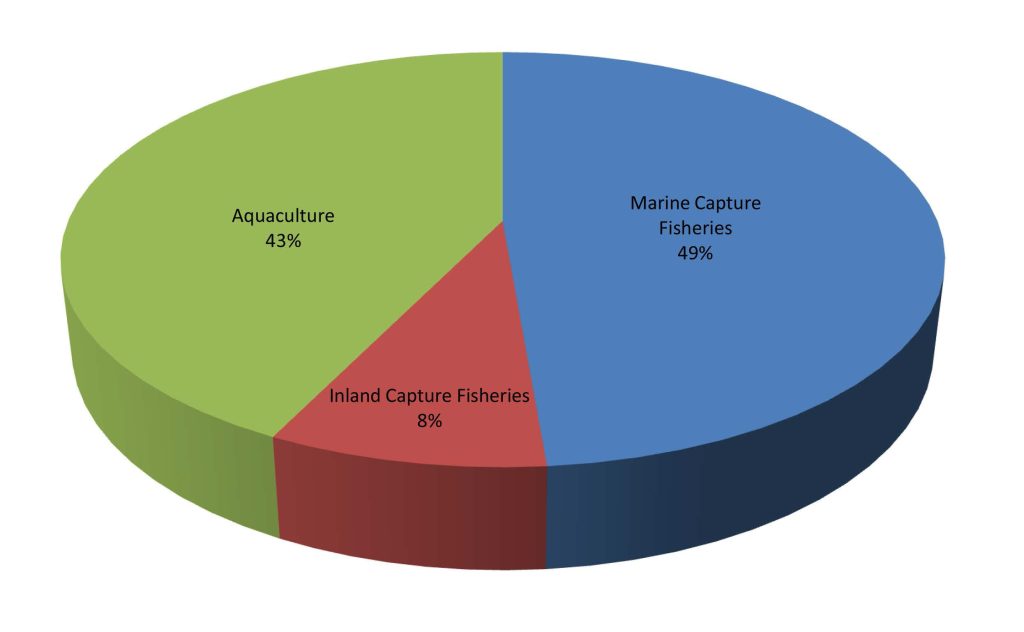
The fishery production of Southeast Asia comes from three sub-sectors, namely: marine capture fisheries, inland capture fisheries, and aquaculture. By sub-sector, the total fishery production of the region in 2016 as shown in Table 3 indicates that the largest portion of the production volume was derived from aquaculture accounting for approximately 55.5%, followed by marine capture fisheries at about 37.6%, and inland capture fisheries at 6.9%. In terms of production value, the trend was quite different as marine capture fisheries accounted for 48.7%, aquaculture at 42.7%, and inland capture fisheries at 8.6% (Fig. 2a and 2b). While the value per metric ton of marine capture fishery products was about US$ 1,171/MT, those from inland capture fisheries and aquaculture were about US$ 1,124/MT and US$ 696/MT, respectively. This implies that the global market had started to recognize the value of aquatic products harvested through inland capture fisheries, and had been lately patronizing such products.
Table 3. Fishery production (quantity and value) of Southeast Asia in 2016
| Sub-sector | Quantity (MT) |
Value* (US$ 1,000) |
Value/Quantity** (US$/MT) |
| Marine capture fisheries | 17,027,312 | 19,939,678 | 1,171 |
| Inland capture fisheries | 3,126,166 | 3,514,981 | 1,124 |
| Aquaculture | 25,182,834 | 17,518,441 | 696 |
| Total | 45,336,312 | 40,973,100 |
*Data not available from Cambodia, Lao PDR and Viet Nam
**Computation of price excludes corresponding quantity production from Cambodia, Lao PDR, and Viet Nam
Fig. 2.a Contribution of the region’s fisheries sub-sectors to the total fishery production of Southeast Asia in 2016 (by quantity)
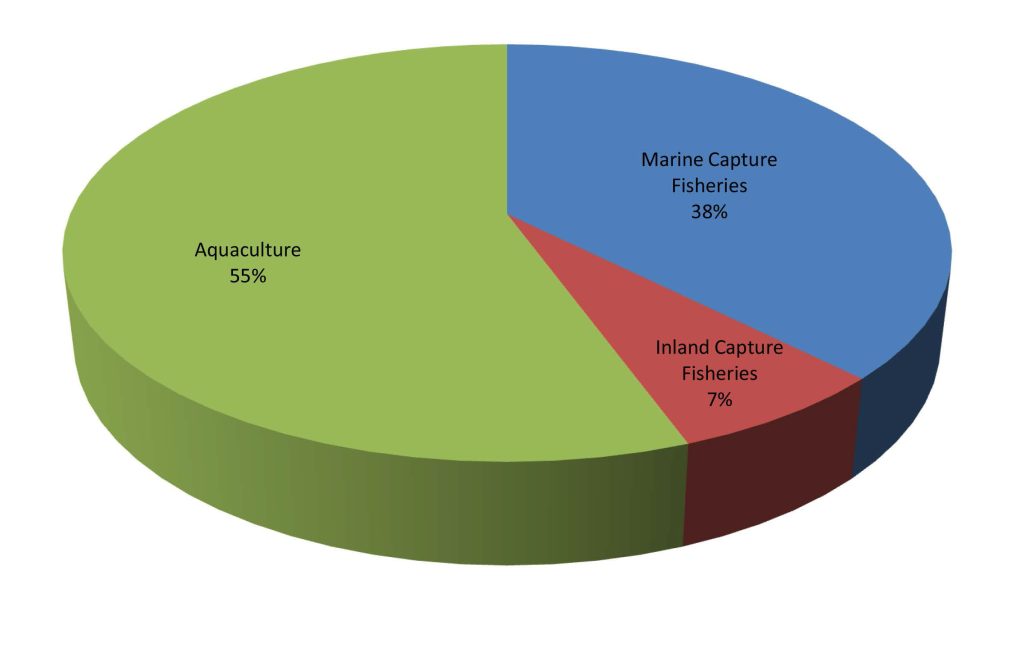
Fig. 2.b Contribution of the region’s fisheries sub-sectors to the total fishery production of Southeast Asia in 2016 (by value)
Marine Capture Fishery Production of Southeast Asia 2016
The region’s production from marine capture fisheries in 2012-2016 had been generally increasing as shown in Table 4. However, in terms of volume, the annual average increase was only minimal at about 2.7%. While the production value in 2016 had increased by 2.4% compared with that of 2015, a drop in value from 2014 to 2015 by about 11.2% was recorded which could have been influenced by the steep dive of the production value of Malaysia and Thailand. The slight increases in the total production values from 2015 to 2016 had been very minimal, and the data of value from Viet Nam and Cambodia were note reported from 2013 to 2016.
Table 4. Marine capture fishery production of Southeast Asia by quantity and value (2012-2016)
| Marine capture fishery production |
2012 | 2013 | 2014 | 2015 | 2016 |
| Quantity (MT) | 15,478,831 | 16,137,163 | 16,853,626 | 16,762,392 | 17,027,312 |
| Value (US$ 1,000) | 20,366,636* | 20,585,615** | 21,654,307** | 19,481,510** | 19,939,678** |
* Data not available from Cambodia
** Data not available from Cambodia and Viet Nam
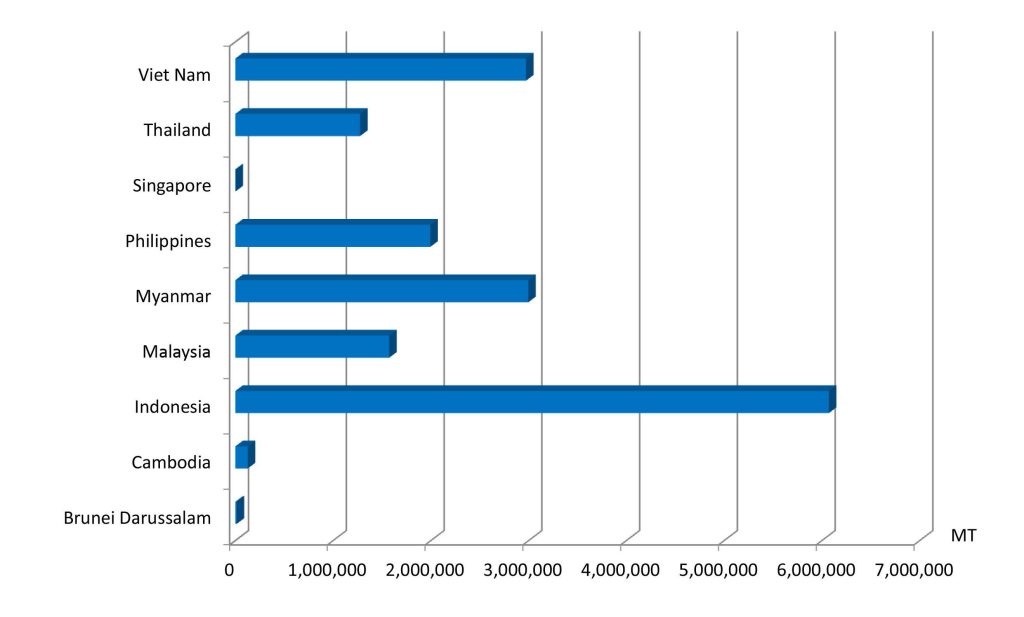
In terms of quantity, the total production from marine capture fisheries of the Southeast Asian countries during 2012-2016 indicated that Indonesia contributed the highest production to the region’s total. Specifically in 2016, Indonesia’s production was 6.07 million MT accounting for approximately 35.7% of the region’s total, followed by Myanmar, Viet Nam, and Philippines at 2.99 million MT (17.6%), 2.97 million MT (17.5%), and 1.99 million MT (11.7%), respectively. Malaysia and Thailand had also produced considerable amount of aquatic commodities from marine capture fisheries at 1.57 million MT (9.2%) and 1.27 million MT (7.5%), respectively. A picture of the region’s production volume from marine capture fisheries in 2016 could be gleaned from Fig. 3.
Fig. 3. Marine capture fishery production of Southeast Asia in 2016
Although some Southeast Asian countries were not able to provide the value of their production from marine capture fisheries, the total value of the region’s marine capture fishery production from 2012 to 2016 seemed to be rather fluctuated. By country, Indonesia which led the Southeast Asian countries, accounted for about 41.9% of the region’s marine capture fishery production value in 2016, with Myanmar emerging second contributing about 25.5%. Meanwhile, Malaysia which came in third in terms of value contributed about 12.3%, the Philippines came in fourth at 12.1%, and lastly, Thailand contributed about 7.9% during the same year.
Aggregating the 2016 production volume from marine capture fisheries by major commodity groups, marine fishes provided the highest volume (Table 5) accounting for about 86.5% followed by crustaceans at 4.2% while the mollusks, invertebrates and seaweeds contributed 3.2%, 0.6%, and 0.2%, respectively. It should be noted that 7.2% was contributed by other commodity groups which could not be appropriately classified as some countries were not able to provide their respective production volume by species, e.g. Viet Nam. In 2016, the production volume of seaweeds had slightly decreased from that of 2015 by about 47.0%, but the production volume of marine fishes and crustaceans had increased by about 2.9% and 11.3%, respectively, compared with the corresponding volume in 2015.
Table 5. Production of the major commodity groups from marine capture fishery in Southeast Asia
| Commodity Group | 2013 | 2014 | 2015 | 2016 | 2017 |
| Marine fishes | 14,032,382 | 14,624,488 | 14,310,199 | 14,726,719 | 14,880,726 |
| Crustaceans | 656,362 | 627,640 | 636,342 | 708,248 | 718,355 |
| Mollusks | 532,871 | 548,348 | 532,192 | 540,958 | 830,724 |
| Seaweed | … | … | 78,230 | 41,457 | 47,271 |
| Invertebrates | … | 118,016 | 2,609 | 105,886 | 92,901 |
| Others | 915,548 | 935,134 | 1,202,820 | 904,044 | 760,300 |
| Total marine capture fishery production (MT) |
16,152,674 | 16,655,092 | 16,762,392 | 17,027,312 | 17,330,277 |
Comparing the volume of the total fishery production in 2016 with that of 2015, an increase in production of the marine fishes was obvious, which could have been influenced by various factors that include: Indonesia’s increased production of various major commodities such as longtail tuna (Thunnus tonggol) from fishing area 572 and 711 , as well as yellowfin tuna (Thunnus albacares), scads nei (Decapterus spp.), crustaceans and production of molluscs; Malaysia’s production of major marine fishes that also increased considerably, especially the Indian scad (Decapterus russelli) from fishing area 57 and 71; and Myanmar’s increased production of marine fishes nei from fishing area 57.
Moreover, the region’s production of the major species such as the Rastrelliger spp. decreased in 2016 compared with that of 2015 which could have been influenced by Thailand’s production. Meanwhile, production of crustaceans in 2016 had increased compared with that of 2015, which could have been brought about by Indonesia’s increased production of the marine crustacean nei from fishing areas 57 and 71, and Malaysia’s increased production of longtail tuna (Thunnus tonggol) from fishing area 57.
1 Fishing area 71 covers the marine fishing areas of Thailand (Gulf of Thailand), Cambodia, Viet Nam (Southwest and Southwest), Malaysia (East Coast of Peninsular Malaysia, Sabah, Sarawak), Singapore, Brunei Darussalam, Philippines (Luzon, Visayas, Mindanao), and Indonesia (East Sumatra, North Java, Bali-Nusa Tenggara, South-West Kalimantan, East Kalimantan, South Sulawesi, North Sulawesi, Maluku-Papua)
2 Fishing area 57 covers the marine fishing areas of Myanmar, Thailand (Indian Ocean), Malaysia (West Coast of Peninsular Malaysia), and Indonesia (Malacca Strait, West Sumatra and South Java, Bali-Nusa Tenggara)
The economically-important marine species that provided sizeable contribution to the total fishery production of Southeast Asia from marine capture fisheries (by quantity and value) in 2016 are shown in Table 6. The data indicate that miscellaneous marine fishes (unidentified) contributed the highest volume at about 38.0% and value at about 29.2%. Production from the tunas group contributed about 10.7% to the total production quantity and ranked the second highest, although it was ranked the highest in terms of value accounting for about 12.7% of the total production value.
Table 6. Production of economically-important marine species in Southeast Asia (as of 2016)
| Group/species | Quantity (MT) |
Percentage of total quantity of marine capture fishery production (%) |
Value (US$1,000) |
Percentage of total value of marine capture fishery production (%) |
Prices (US$/MT) |
| Tunas Frigate tuna Bullet tuna Kawakawa Skipjack tuna Longtail tuna Albacore tuna Southern bluefin tuna Yellowfin tuna Bigeye tuna |
1,813,292 |
10.65 |
2,537,820 396,841 47,244 295,635 812,176 198,053 11,501 898 606,798 168,674 |
12.73 |
1,400 1,234 1,405 1,093 1,221 1,527 1,602 1,300 1,932 2,379 |
| Scads Scads nei Bigeye scad Yellowstripe scad Hardtail scad |
1,259,917 832,139 213,091 82,079 132,608 |
7.40
|
1,349,909 820,310 302,312 99,550 127,737 |
6.77 | 1,071 986 1,414 1,213 963 |
| Mackerels Scomber mackerels nei Indian mackerels nei Queenfishes nei |
874,770 3,184 689,325 182,261 |
5.14 | 1,487,079 2,001 1,028,377 456,701 |
7.46 | 1,700 628 1,492 2,506 |
| Anchovies Stolephorus anchovies Other anchovies |
432,042 302,434 129,608 |
2.54 | 394,482 340,369 65,649 |
1.98
|
913 1,125 506 |
| Crustaceans | 712,035 | 4.18 | 2,046,589 | 10.26 | 2,874 |
| Mollusks | 540,959 | 3.18 | 1,099,862 | 5.52 | 2,033 |
| Marine fishes unidentified |
6,468,431 | 37.99 | 5,827,750 | 29.23 | 901 |
The data in Table 6 also suggest that the production value of crustaceans group is valued the highest among the commodities harvested through marine capture fisheries at US$ 2874/MT followed by Scomberomorus spp. (seerfishes nei) at US$ 2506/MT; Thunnus obesus (bigeye tuna) at US$ 2379/MT; the mollusks group at US$ 2033/MT; Thunnus alalunga (albacore tuna) at US$ 1932/MT; Thunnus albacares (yellowfin tuna) at US$ 1602/MT; Thunnus tonggol (longtail tuna) at US$ 1527/MT; Rastrelliger spp. (other rastrelliger species) at US$ 1492/MT; Selar crumenophthalmus (bigeye scad) at US$ 1414/MT; Auxis rochei (bullet tuna) at US$ 1405/MT; Thunnus maccoyii (southern bluefin tuna) at 1300/MT; Auxis thazard (frigate tuna) at US$ 1234MT; and Katsuwonus ppelamis (skipjack tuna) at US$ 1221/MT. The average price of miscellaneous marine fishes (unidentified) which contributed the highest volume in 2016 was estimated at US$ 901/MT, implying that this group must have generated low-value fishes that possibly include trash fishes.
Inland Capture Fishery Production of Southeast Asia
Southeast Asia’s production from inland capture fisheries from 2012 to 2016 had generally increased and its growth during the same period had been remarkable. The region’s total production from inland capture fisheries in 2016 was 3,126,166 MT accounting for approximately 15.5% of the region’s total capture fishery production or 6.9% of the region’s total fishery production. It should be recognized however that the compilation and reporting of production data from inland capture fisheries had been particularly weak and need to be improved. Thus, the data so far reported could be insufficient in terms of species composition. It should also be considered that in the real situation, the catch of rural community members comprising the main users of the inland resources, is consumed locally and is usually not reported in local or national statistics. Accordingly, the data on the total catch from inland capture fisheries in this publication could be considered as indicative only.
While countries reported their respective data on production from inland capture fisheries during 2012-2016, only five countries reported their corresponding production values. Thus, the actual regional production trend of the inland capture fisheries sub-sector could not be established. At any rate, as the consistent top producer, Myanmar maintains a stable inland fishery production from 2012 to 2016 that accounted for 34.5% of the country’s total production from capture fisheries, 28.2% of the country’s total fishery production, and 3.5% of the region’s total fishery production (Table 7).
Table 7. Contribution of Southeast Asian countries’ inland capture fisheries to the region’s total fishery production in 2016
| Country | Inland capture production (MT) |
Total capture production (MT) |
% of inland capture production to total capture production |
Total fishery production (MT) |
% of inland capture fishery production to total fishery production |
| Brunei Darussalam |
… | 13,292 | … | 14,114 | … |
| Cambodia | 509,350 | 636,050 | 80.1 | 808,550 | 63.0 |
| Indonesia | 426,874 | 6,497,839 | 6.6 | 23,172,872 | 1.8 |
| Lao PDR | 70,915 | 70,915 | 100 | 166,880 | 42.5 |
| Malaysia | 5,848 | 1,580,295 | 0.4 | 1,987,984 | 0.3 |
| Myanmar | 1,580,670 | 4,577,410 | 34.5 | 5,598,003 | 28.2 |
| Philippines | 155,509 | 2,149,847 | 7.2 | 4,350,761 | 3.6 |
| Singapore | … | 1,235 | … | 7,347 | … |
| Thailand | 187,300 | 1,463,295 | 12.8 | 2,425,901 | 7.7 |
| Viet Nam | 189,700 | 3,163,300 | 6.0 | 6,803,900 | 2.8 |
| Total | 3,126,166 | 20,153,478 | 15.51 | 45,336,315 | 6.9 |
The second highest producer, Cambodia reported production volume of 509,350 MT in 2016 that represented 80.1% of the country’s production from capture fisheries, 63.0% of the country’s total fishery production. However, such production volume could not be confirmed as accurate considering that the country needs to improve its systems of collecting and compiling the fishery statistics, especially with regards to the production from inland capture fisheries.
Only four countries, namely: Brunei Darussalam, Indonesia, Philippines, and Thailand, had provided their respective production data from inland capture fisheries by species, while the other countries were not able to report due to inadequacy of expertise in identifying the catch by species. Capacity building in this aspect is therefore necessary to enable the countries to compile their respective inland fishery production by major groups of species. Thus, production from inland capture fisheries of Myanmar, Malaysia, Lao PDR, Cambodia, and Viet Nam in 2016 could not be analyzed in terms of species because some of the countries were not able to provide the breakdown of production volume by species. However, the production of Indonesia as the region’s third highest producer was made up mainly of the striped snakehead (Channa striata) which accounted for about 10.8% of the country’s total production from inland capture fisheries.
Next to miscellaneous fishes which provided the highest production from inland capture fisheries accounting for 80.1% of the region’s total inland fishery production in 2016 (Table 8), production of striped snakehead (Channa striata) was the second highest at 2.3% followed by Nile tilapia (Oreochromis niloticus) at 1.8%, freshwater mollusks at 1.7%, Asian redtail catfish (Hemibagrus nemurus) at 1.4%, Tilapia nei (Oreochromis (=Tilapia) spp.) at 1.3%, and climbing perch (Anabas testudineus) at 1.1%. Although the current reported production of the giant river prawn (Macrobrachium rosenbergii) was relatively low at 12,205 MT, its value per metric ton of production was the highest at US$ 3244/MT followed by glass catfishes at US$ 2750/MT, the Asian redtail catfish at US$ 2605/MT, and striped snakehead at US$ 2002/MT.
Table 8. Production of major inland fisheries species in Southeast Asia in 2016
| Common name | Quantity (MT) |
Percentage total quantity of major inland species to total inland capture production (%) |
Value (US$ 1,000) |
Percentage total value of major inland species to total inland capture production (%) |
Price (US$/MT) |
| Misc. fishes | 2,502,626 | 80.1 | 2,475,833 | 70.4 | 989 |
| Striped snakehead | 70,802 | 2.3 | 141,740 | 4.0 | 2,002 |
| Freshwater mollusks nei | 54,649 | 1.7 | 5,284 | 0.2 | 97 |
| Tilapias nei | 41,677 | 1.3 | 51,392 | 1.5 | 1,233 |
| Nile tilapia | 56,251 | 1.8 | 82,750 | 2.3 | 1,471 |
| Snakeskin gourami | 33,750 | 1.1 | 36,398 | 1.0 | 1,078 |
| Torpedo-shaped catfishes nei |
28,627 | 0.9 | 44,059 | 1.2 | 1,539 |
| Silver barb | 31,848 | 1.0 | 38,294 | 1.1 | 1,202 |
| Cyprinids nei | 30,688 | 1.00 | 30,913 | 0.88 | 1,007 |
| Asian redtail catfish | 43,023 | 1.4 | 112,063 | 3.2 | 2,605 |
| Glass catfishs | 21,084 | 0.7 | 57,977 | 1.6 | 2,750 |
| Giant river prawn | 12,205 | 0.4 | 39,594 | 1.6 | 3,244 |
Aquaculture Production of Southeast Asia
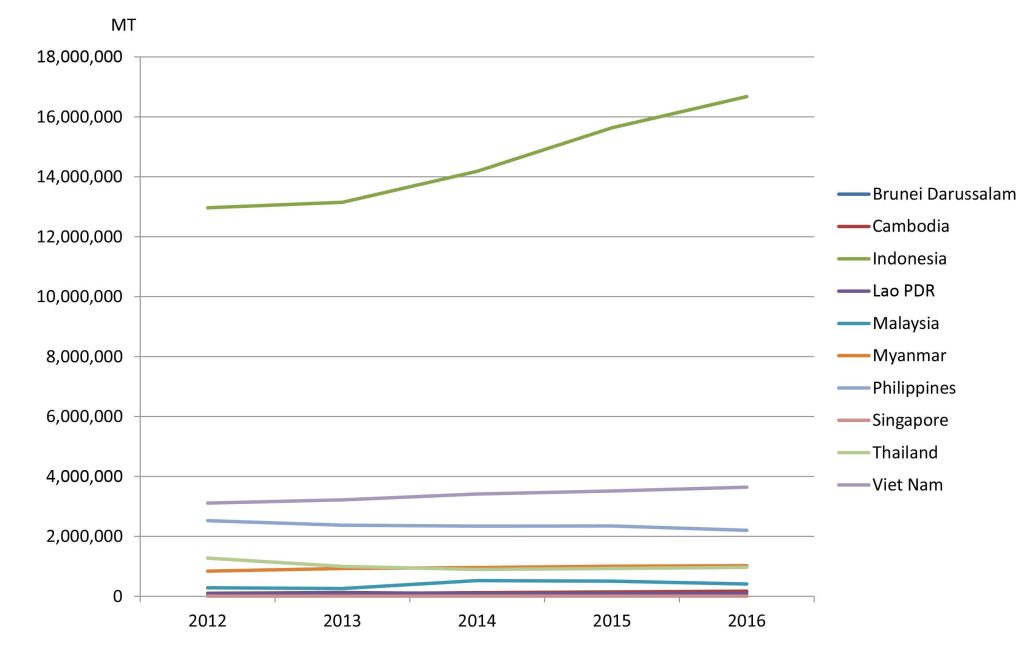
In 2016, the region’s total production from aquaculture accounted for about 55.6% of the region’s total fishery production in terms of volume and 42.7% in terms of value. From 2012 to 2016, Southeast Asia’s total production from aquaculture steadily increased at about 4.5% per year (Fig. 4), the highest annual increase of about 7.3% was recorded between 2014 and 2015, which could have been brought about by the sudden rise in the aquaculture production of Indonesia, Myanmar, and Viet Nam during the same period that also continued to increase until 2016. The aquaculture production of Cambodia, Lao PDR, Singapore, and Thailand had been slightly increasing from 2014 to 2016, while that of the other Southeast Asian countries also continued to increase, except that of Malaysia which had decreased starting in 2014.
Production of aquatic plants nei of Indonesia as the largest producer of aquaculture products in 2016, contributed 69.8% in terms of production volume and 12.7% in production value to the country’s aquaculture production. This was followed by Nile tilapia (Oreochromis niloticus) accounting for 7.1%, torpedo-shaped cafishes (Clarias spp.) at 5.2%, and milkfish (Chanos chanos) at 4.4%. In the case of Viet Nam, as the second highest producer from aquaculture, 70.4% of its aquaculture production came from freshwater fishes nei (Osteichthyes) followed by freshwater prawns nei which accounted for 18.1% of the country’s aquaculture production. For the Philippines as the third highest producer from aquaculture, its main aquaculture product is the elkhorn sea moss (Kappaphycus alvarezii) contributing 59.1% to the country’s production from aquaculture followed by milkfish (Chanos chanos) accounting for 18.1%, Nile tilapia (Oreochromis niloticus) at 7.3%, and spiny Eucheuma (Eucheuma denticulatum) at 4.7%. For Myanmar, its main production from aquaculture is roho labeo (Labeo rohita) which accounted for 60.3% of the country’s production from aquaculture followed by mrigal carp (Cirrhinus mrigala) accounting for 7.0%, catla (Catla catla) accounting for 6.5%, giant tiger shrimp (Penaeus monodon) at 5.3%, pangas catfishes nei (Pangasius spp.) at 4.2%, and tilapias nei (Tilapia spp.) at 3.2%. Thailand’s main aquaculture product is the whiteleg shrimp (Penaeus vannamei) accounting for 32.6% of the country’s production from aquaculture followed by Nile tilapia (Oreochromis niloticus) at 21.6%, green mussel (Perna viridis) at 12.0%, and hybrid catfishes (C. gariepinus x C. macrophalus) at 11.7%.
In terms of value per volume of aquaculture production in 2016, Singapore attained the highest average value at US$ 9129/MT followed by Brunei Darussalam at US$ 5034/ MT, Thailand at US$ 2585/MT, Myanmar at US$ 1950MT, Malaysia at US$ 1747/MT, Philippines at US$ 893/MT, and Indonesia at US$ 618/MT. Meanwhile, the value per metric ton of aquaculture produc on of Cambodia, Lao PDR, and Viet Nam in 2016 could not be calculated as these countries did not report their respective total production values.
Fig 4. Trend of the aquaculture production of the Southeast Asian countries from 2012 to 2016 (MT)
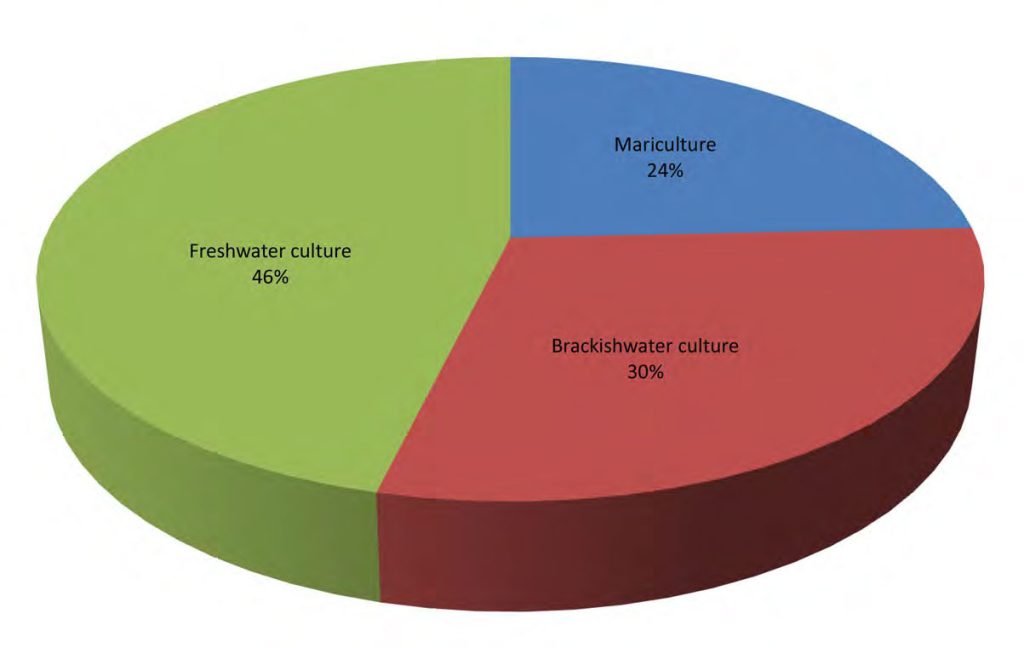
Aquaculture production comes from three environments, namely: marine, brackishwater, and freshwater. In terms of volume, aquaculture in marine areas or mariculture provided 57.0% to the region’s total aquaculture production in 2016 while brackishwater aquaculture contributed 9.0%, and the remaining 34.0% came from freshwater culture (Fig. 5a and 5b). In terms of value, freshwater culture production contributed the highest at 46.0% followed by brackishwater aquaculture production at 30.0% and mariculture production at 24.0%.
Fig. 5a. Production by the aquaculture sub-sectors in 2016 (by quantity)
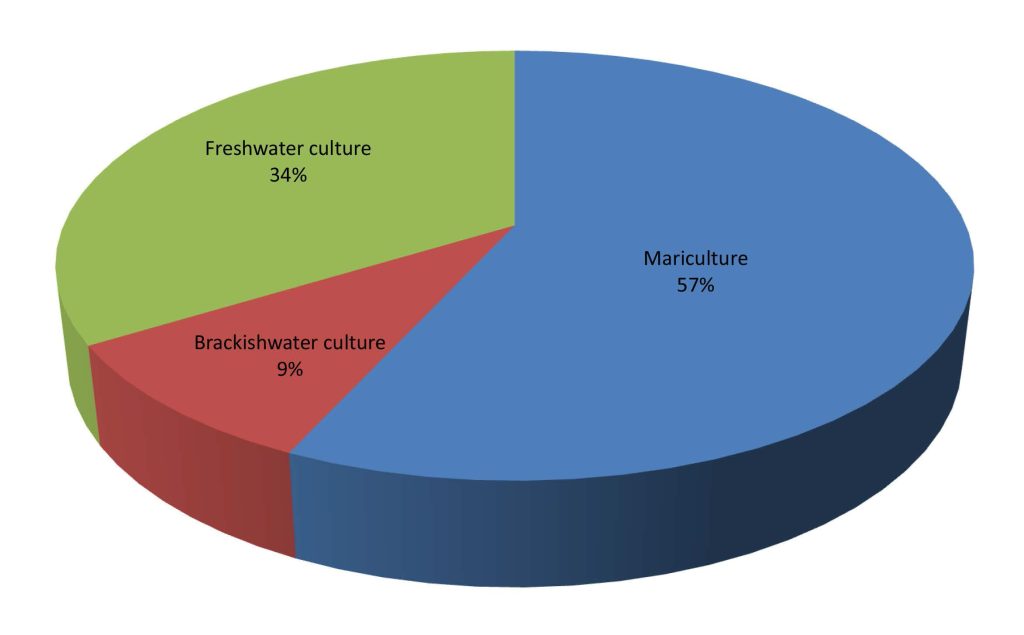
Fig. 5b. Production by the aquaculture sub-sectors in 2016 (by value)
It should be recalled that in 2015, production from mariculture accounted for 54.0% of the total aquaculture production in terms of volume, while brackishwater culture production accounted for 13.0% and freshwater culture production at 33.0%. In terms of value, mariculture contributed 14.0% to the region’s total aquaculture production value, brackishwater culture production at 40.0%, and freshwater culture production at 46.0%. This means that in 2016, the production value from mariculture increased by 97.6% from that of 2015 which could be due to the increased production of miscellaneous fishes nei in Viet Nam. While production from brackishwater culture in 2016 compared with that of 2015 decreased by 17.9% which could be due to the decreasing value of the production of Indonesia, Malaysia, and Philippines, the region’s production value from freshwater culture increased by 11.2%.
Mariculture
In 2016, the region’s total production from mariculture contributed about 57.0% to the region’s total production in terms of volume and 24.0% in terms of value. Farmed aquatic plants contributed 92.6% to the region’s total volume of mariculture production, such as the spiny Eucheuma (Eucheuma denticulatum), and the elkhorn sea moss (Kappaphycus alvarezii). Production of aquatic plants nei mainly from Indonesia accounted for 81.3% of the region’s total production volume from mariculture, followed by the elkhorn sea moss (Kappaphycus alvarezii) the main products of the Philippines which accounted for 9.1%, green mussel (Perna viridis) and blood cockle (Anadara granosa) mainly produced by Thailand at 0.8% and 0.4%, respectively, the spiny Eucheuma (Eucheuma denticulatum) mainly produced by the Philippines at 0.7%, and oysters group mainly produced by the Philippines and Thailand at 0.3% (Fig. 6a).
In terms of value, aquatic plants nei contributed 30.8% to the region’s total mariculture production value followed by shrimps which contributed about 12.1%, elkhorn sea moss at 3.6%, and blood cockle accounting for 2.3%. In addition, marine fishes contributed 0.98%, green mussel at 0.91%, and oyster at 0.68%, to the total value of the region’s mariculture production (Fig. 6b). Moreover, shrimps earned the highest value per volume at US$ 9500/MT followed by marine fishes at US$ 8301/MT, while the lowest value was obtained for the spiny Eucheuma at US$ 59/MT (Table 9).
Fig 6a. Production of major species from mariculture in 2016 (by quantity)
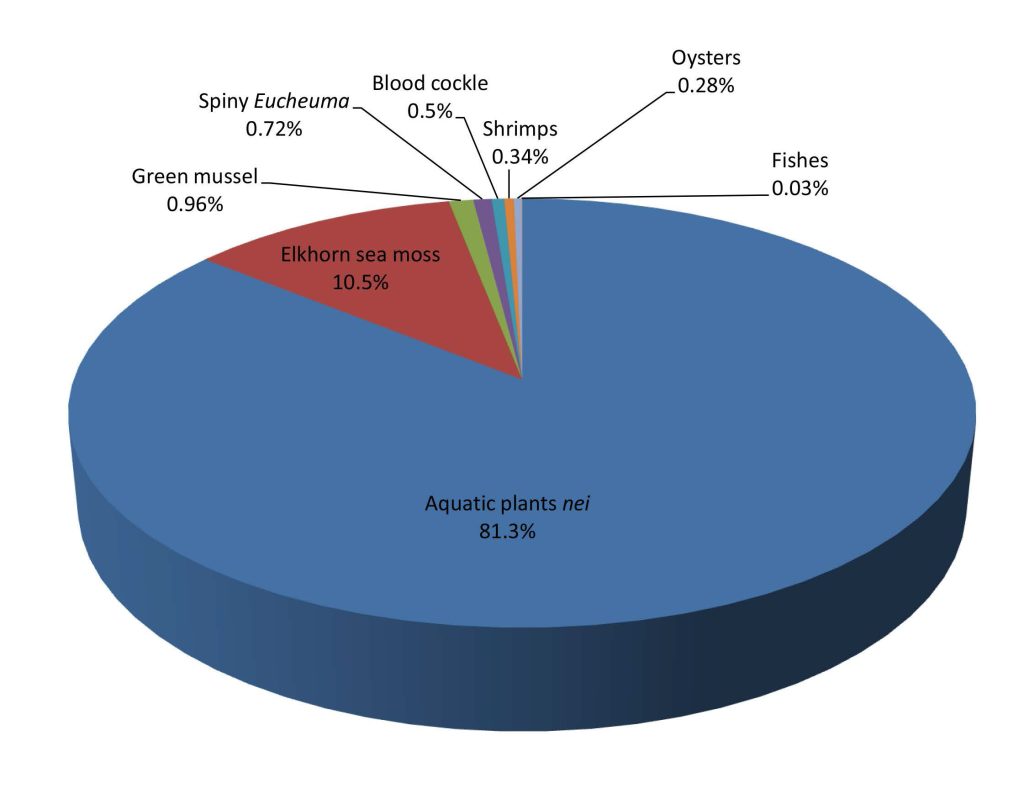
Fig 6b. Production of major species from mariculture in 2016 (by value)
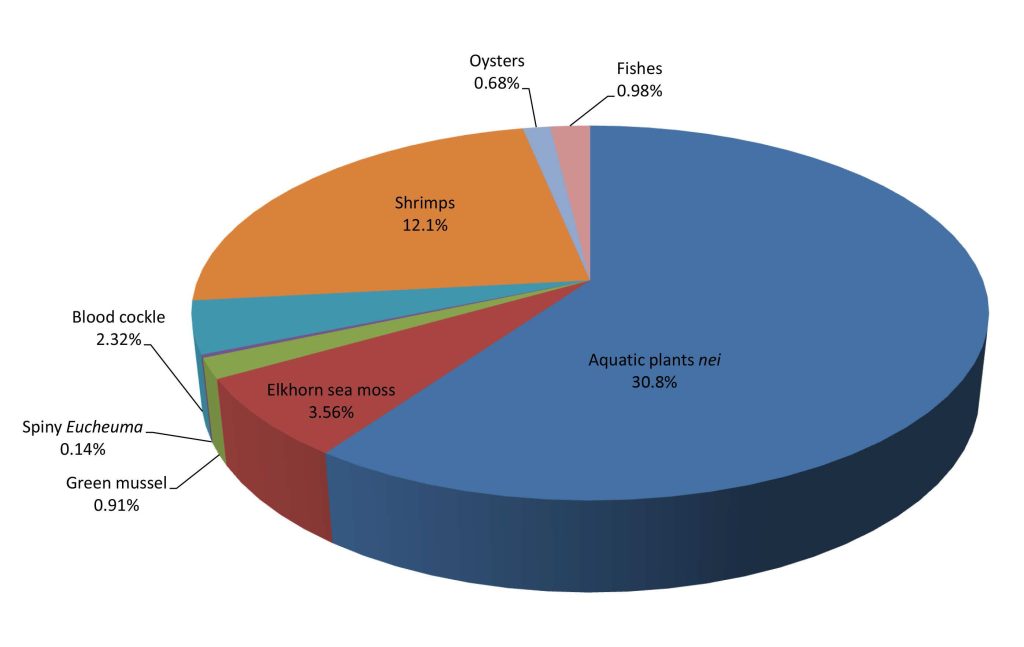
Table 9. Major mariculture species produced in the region (as of 2016)
| Common name | Quantity (MT) |
Percentage production of major commodities from mariculture to total mariculture production (%) |
Value (US$ 1,000) |
Percentage total value of major commodities production from mariculture to total mariculture value (%) |
Price (US$/MT) |
| Aquatic plants nei | 11,631,586 | 81.3 | 1,310,945 | 30.8 | 113 |
| Elkhorn sea moss | 1,507,142 | 10.5 | 151,447 | 3.56 | 100 |
| Green mussel | 136,615 | 0.96 | 38,715 | 0.91 | 283 |
| Spiny eucheuma | 102,496 | 0.72 | 6,047 | 0.14 | 59 |
| Blood cockle | 71,098 | 0.50 | 98,576 | 2.32 | 1,386 |
| Shrimps | 54,179 | 0.34 | 514,701 | 12.10 | 9,500 |
| Oysters | 40,528 | 0.28 | 28,757 | 0.68 | 710 |
| Fishes | 5,000 | 0.03 | 41,506 | 0.98 | 8,301 |
For the value per volume of mariculture production in 2016, Myanmar posted the highest at an average of US$ 9500/MT from its production of the highly economical species of shrimps, followed by Brunei Darussalam at US$ 7370/MT for its giant sea perch (Lates calcarifer), and Singapore at US$ 7810/MT for its production of giant sea perch (Lates calcarifer). Meanwhile, the mariculture production value of Thailand was at US$ 703/MT, Philippines at US$ 540/MT, Indonesia at US$ 214/MT, and Malaysia at US$ 193/MT.
Brackishwater Culture
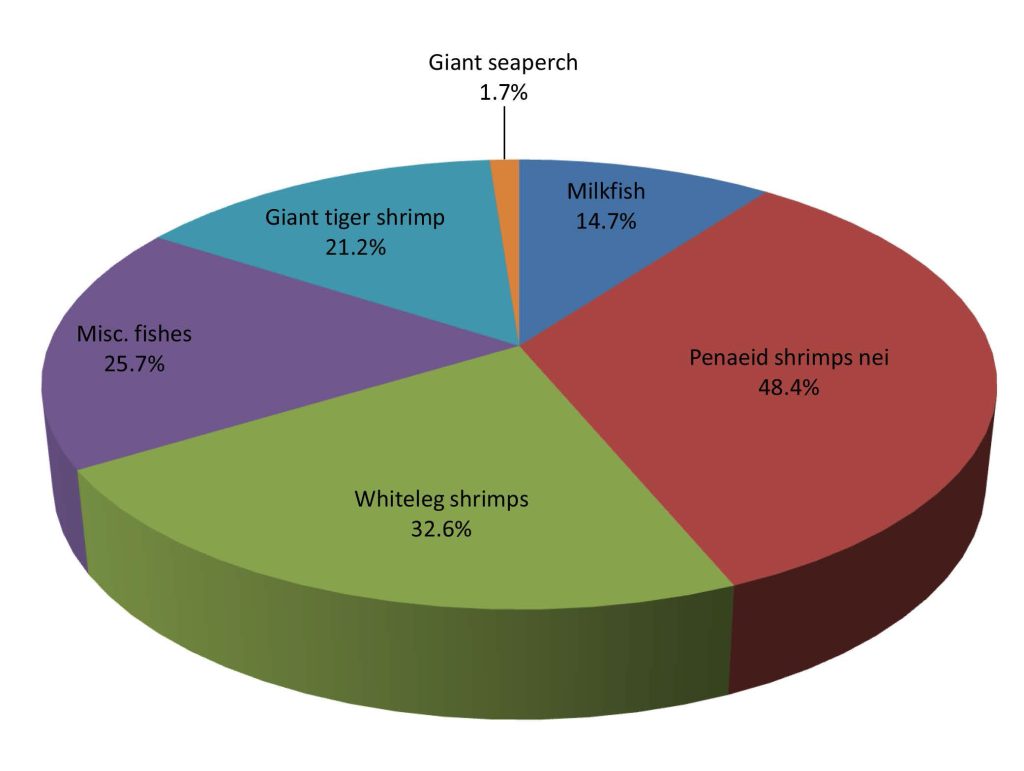
The total production from brackishwater culture in 2016 represented about 9.0% of the region’s total production from aquaculture (Fig. 7a and 7b). Production of milkfish (Chanos chanos) mainly produced by the Philippines and Indonesia had the highest volume representing 48.1% of the region’s total production from brackishwater culture. The second highest was contributed by from penaeid shrimps nei (Penaeus spp.) at 28.6% main contributed by Indonesia, and the third came from whiteleg shrimps (Penaeus vannamei) at 15.2% mainly contributed by Thailand, miscellaneous fishes provided 4.4%, and giant tiger shrimp (Penaeus monodon) at 2.9% mainly contributed by the Philippines. In terms of value, the highest was provided by the penaeid shrimps nei (Penaeus spp.) with Indonesia contributing the highest value at 48.4%, followed by whiteleg shrimp (Penaeus vannamei) with Malaysia and Thailand contributing the highest value at 32.6%, marine fi shes at 25.7%, giant tiger shrimp (Penaeus monodon) from Philippines, Thailand, and Malaysia at 21.2%, and giant sea perch (Lates calcarifer) produced by the Philippines at 1.7%.
Fig 7a. Production of major brackishwater culture species in 2016 (by quantity)
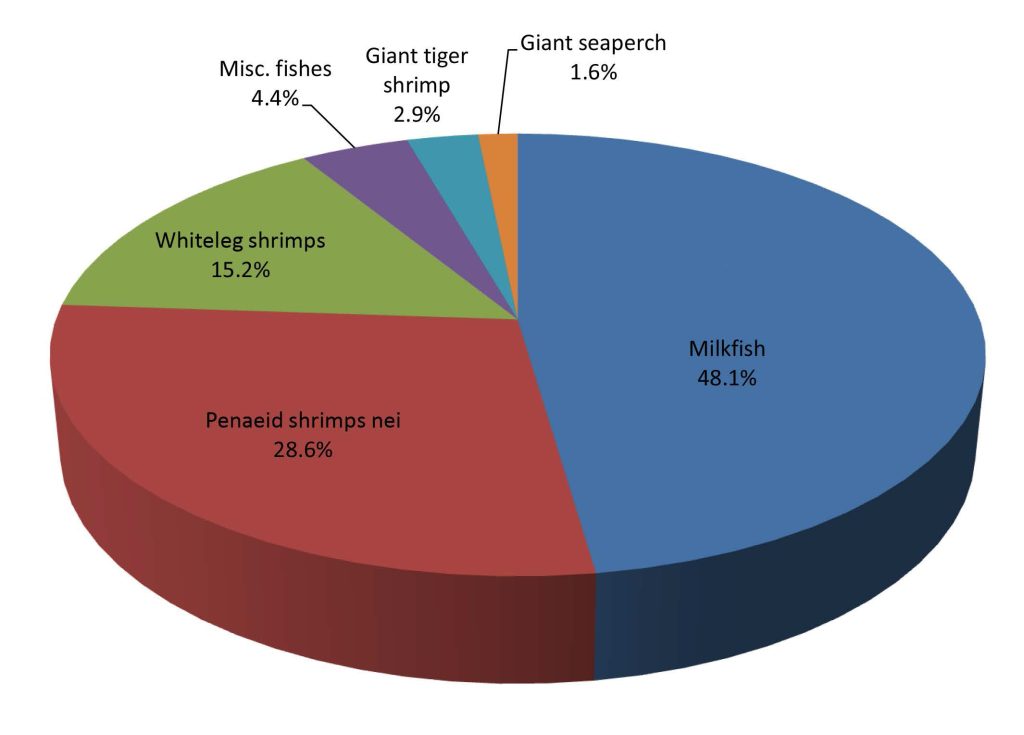
Fig 7b. Production of major brackishwater culture species in 2016 (by value)
In terms of average value per volume of production from brackishwater culture, considering only the countries that reported their respective production values, Singapore posted the highest at US$ 20048/MT, followed by Malaysia at US$ 5417/MT, Philippines at US$ 5098/MT, Brunei Darussalam at US$ 4691/MT, Thailand at US$ 4651/MT, and Indonesia at US$ 1363/MT. Cambodia and Viet Nam did not report their respective production from brackishwater aquaculture in terms of volume and value. The highest value per metric ton of production was attained by the giant tiger shrimp at US$ 16116/MT followed by marine fishes nei at US$ 12619/MT, whiteleg shrimp at US$ 4663/MT, penaeid shrimps nei at US$ 3678/MT, giant sea perch at US$ 2261/MT, while milkfish obtained the lowest at US$ 668/MT (Table 10).
Table 10. Major brackishwater species cultured in the region (as of 2016)
| Common name | Quantity (MT) |
Percentage brackishwater culture production of major commodities to total brackishwater culture production (%) |
Value (US$ 1,000) |
Percentage total value of major commodities production from brackishwater culture to total brackishwater culture value (%) |
Price (US$/MT) |
| Milkfish | 1,141,030 | 48.1 | 762,078 | 14.7 | 668* |
| Penaeid shrimps nei | 680,316 | 28.6 | 2,502,108 | 48.4 | 3,678 |
| Whiteleg shrimp | 361,851 | 15.2 | 1,687,173 | 32.6 | 4,663 |
| Misc. fishes | 105,198 | 4.4 | 1,327,480 | 25.7 | 12,619* |
| Giant tiger prawn | 67,860 | 2.9 | 1,093,668 | 21.2 | 16,116 |
| Giant seaperch | 38,286 | 1.6 | 86,583 | 1.7 | 2,261 |
*Computation of price excludes corresponding quantity production from Indonesia as data on production value is not available
Freshwater Culture
The region’s total production from freshwater culture in 2016 accounted for about 34.0% of the region’s total production from aquaculture, an increase of about 8.4% from that of the 2015. In 2016, Viet Nam was the highest producer from freshwater aquaculture contributing about 39.5% of the region’s total production from freshwater culture, followed by Indonesia at 37.0%, Myanmar at 11.3%, Thailand at 4.9%, Philippines at 3.1%, Cambodia at 1.9%, Malaysia at 1.2%, and Lao PDR at 1.1%.
Accounting for 46.0% of the region’s total aquaculture production value in 2016, the freshwater culture sub-sector seems to have emerged as a very important fisheries sub-sector. This is considering that its production value in 2016 had slightly increased by almost 11.2% compared with that of 2015, although this information could be underestimated due to the missing corresponding production values from Cambodia, Lao PDR, and Viet Nam.
In terms of production volume from freshwater culture by species (Fig 8a and 8b), miscellaneous freshwater fishes accounted for 33.3% of the region’s total production from freshwater culture, which was mainly contributed by Viet Nam. This was followed by Nile tilapia (Oreochromis niloticus) which accounted for 18.4% and contributed mainly by Indonesia, Thailand, and the Philippines, and the torpedo-shaped catfish (Clarias spp.) followed at 10.9% which was contributed mainly by Indonesia, freshwater prawns nei came in next at 8.1% contributed mainly by Viet Nam, roho labeo (Labeo rohita) at 7.3% contributed mainly by Myanmar, common carp (Cyprinus carpio) accounted for 6.1% contributed by Indonesia, and pangas catfishes nei (Pangasius spp.) at 5.6% mainly contributed by Indonesia.
Fig. 8a. Production of major freshwater culture species in 2016 (by quantity)
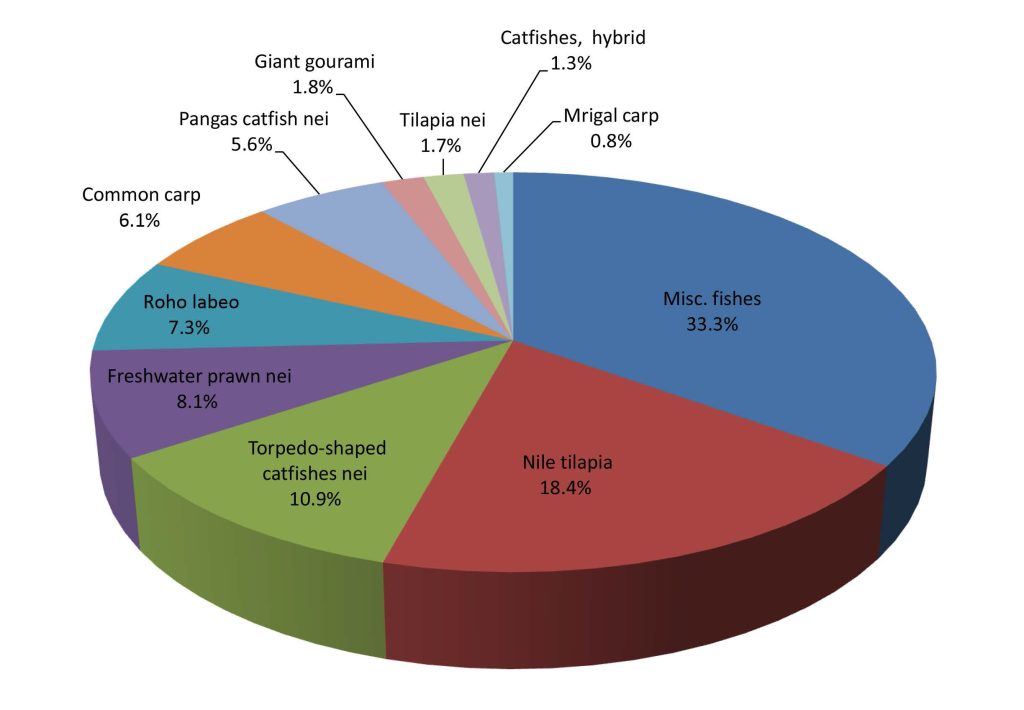
Fig. 8b. Production of major freshwater culture species in 2016 (by value)
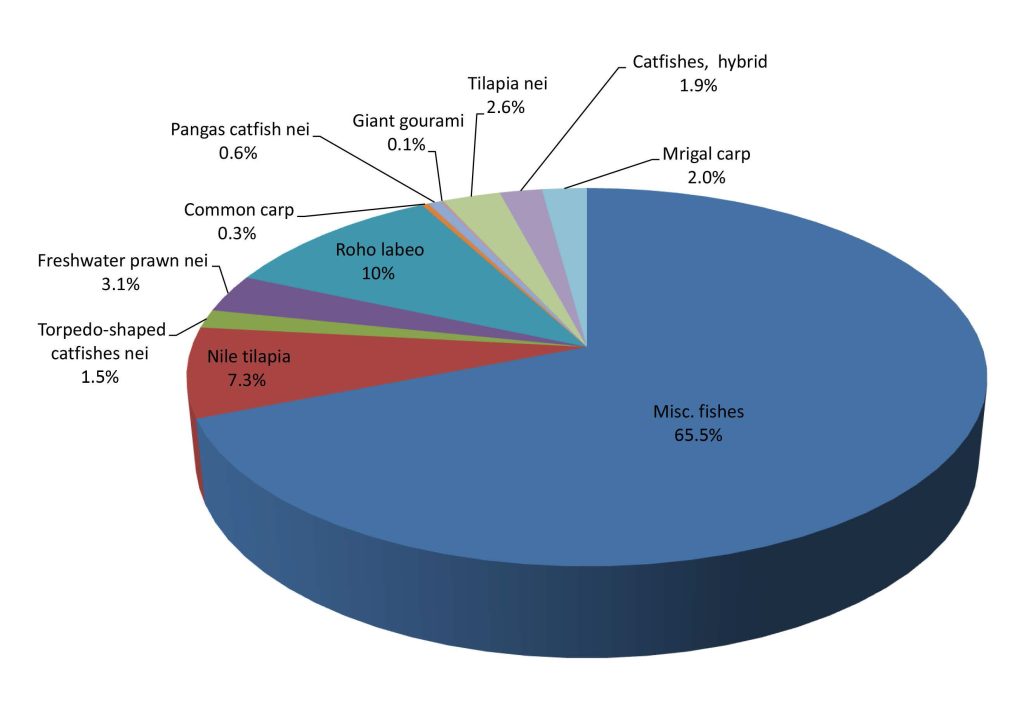
On production value, the highest contributor to the region’s total production value from freshwater culture in 2016 was the group of miscellaneous freshwater fishes which accounted for 65.5% of the region’s total production from freshwater culture, followed by roho labeo (10.0%), Nile tilapia at 7.3%, freshwater prawns nei (3.1%), tilapia nei (2.6%), mrigal carp (2.0%), catfishes hybrid (1.9%), torpedoshaped catfishes (2.0%), giant river prawn (1.9%), and pangas catfishes nei (0.6%). For the value per volume of major freshwater culture species, the highest was earned by mrigal carp at US$ 2296/MT followed by miscellaneous freshwater fishes at US$ 1871/MT, tilapia nei at US$ 1475/MT, catfishes hybrid at US$ 1391/MT, and roho labeo at US$ 1301/MT (Table 11).
Table 11. Major freshwater species cultured in the region (as of 2016)
| Common name | Quantity (MT) |
Percentage freshwater culture production of major commodities to total freshwater culture production (%) |
Value (US$ 1,000) |
Percentage total value of major commodities production from freshwater culture to total freshwater culture value (%) |
Price (US$/MT) |
| Misc. fishes | 2,832,540 | 33.3 | 5,300,162 | 65.5 | 1,871* |
| Nile tilapia | 1,562,589 | 18.4 | 589,672 | 7.3 | 377 |
| Torpedo-shaped catfishes nei |
928,180 | 10.9 | 121,229 | 1.5 | 131 |
| Freshwater prawns nei |
689,606 | 8.1 | 250,230 | 3.1 | 363* |
| Roho labeo | 621,390 | 7.3 | 808,570 | 10.0 | 1,301 |
| Common carp | 519,041 | 6.1 | 23,686 | 0.3 | 46 |
| Pangas catfish nei | 479,713 | 5.6 | 46,831 | 0.6 | 98 |
| Giant gourami | 153,307 | 1.8 | 7,131 | 0.1 | 47 |
| Tilapia nei | 143,898 | 1.7 | 212,231 | 2.6 | 1,475 |
| Catfishes, hybrid | 112,418 | 1.3 | 156,366 | 1.9 | 1,391 |
| Migral carp | 71,355 | 0.8 | 163,798 | 2.0 | 2,296 |
*Computation of price excludes corresponding quantity production from Viet Nam
Furthermore, for the value of production from freshwater culture by country, Singapore presented the highest average value at US$ 11912/MT mainly coming from its production of the Mozambique tilapia (Oreochromis mossambicus). This was followed by Brunei Darussalam at US$ 4000/MT mainly for its production also of the Mozambique tilapia (O. mossambicus), Malaysia at US$ 1982/MT also for its production of torpedoshaped catfishes nei, Thailand at US$ 1755/MT, Indonesia at US$ 1690/MT, Myanmar at US$ 1502/MT, and Philippines at US$ 1474/MT.
Fishing Gear Analysis
As of 2016, the information on fishing gear used in the region reflected in this publication, was based on the production from marine capture fisheries by type of fishing gear as reported by four countries, namely: Brunei Darussalam, Malaysia, Singapore, and Thailand. From such information, the highest production by type of gears in Brunei Darussalam was from gill nets which accounted for about 51.5% of the total production of all types of gears, with penaeid shimps nei (Penaeus spp.) and chacunda gizzard shad (Anodonstostoma chacunda) as the main catch. This was followed by hook and lines at 18.0% catching yellowtail scad (Atule mate), trawl at 15.2% catching threadifn breams nei (Nemipterus spp.) and sulphur goatfish (Upeneus sulphureus) that comprised almost all of the commodities produced.
For Malaysia, trawls were very prominent with total catch that accounted for 46.1% of the country’s production from all types of gears, of which trash fishes comprised 31.0% of the trawl’s total production. This was followed by purse seines contributing about 25.7% to the total production from all types of gears, where scads (Decapterus spp.) comprised 29.8% of the total production from purse seines. Gill net came third contributing 19.1% to the production from all types of gears, where Indian mackerels nei (Rastrelliger spp.) accounted for about 30.0% of the total production from gill nets.
For Thailand, trawls gave the highest production by type of gears for about 43.8% producing mainly trash fishes that represented about 53.7%, common squids nei (Loligo spp.) about 10.6%, and threadfin breams nei (Nemipterus spp.) about 4.5%. Purse seines came in second contributing 34.0% to the production from all types of gears catching the Stolephorus anchovies (Stolephorus spp.) representing about 12.4%, Sardinellas nei (Sardinella spp.) about 12.1%, scads nei (Decapterus spp.) about 11.1%, and trash fishes about 10.6%.
In the case of Singapore, trawls gave the highest production by type of gears for about 100.0% with penaeid shrimps nei ( Penaeus spp.) accounting for about 22.4%, marine fishes about 8.3%, Indo-Pacific swamp crab (Portunus pelagicus) about 5.3%.
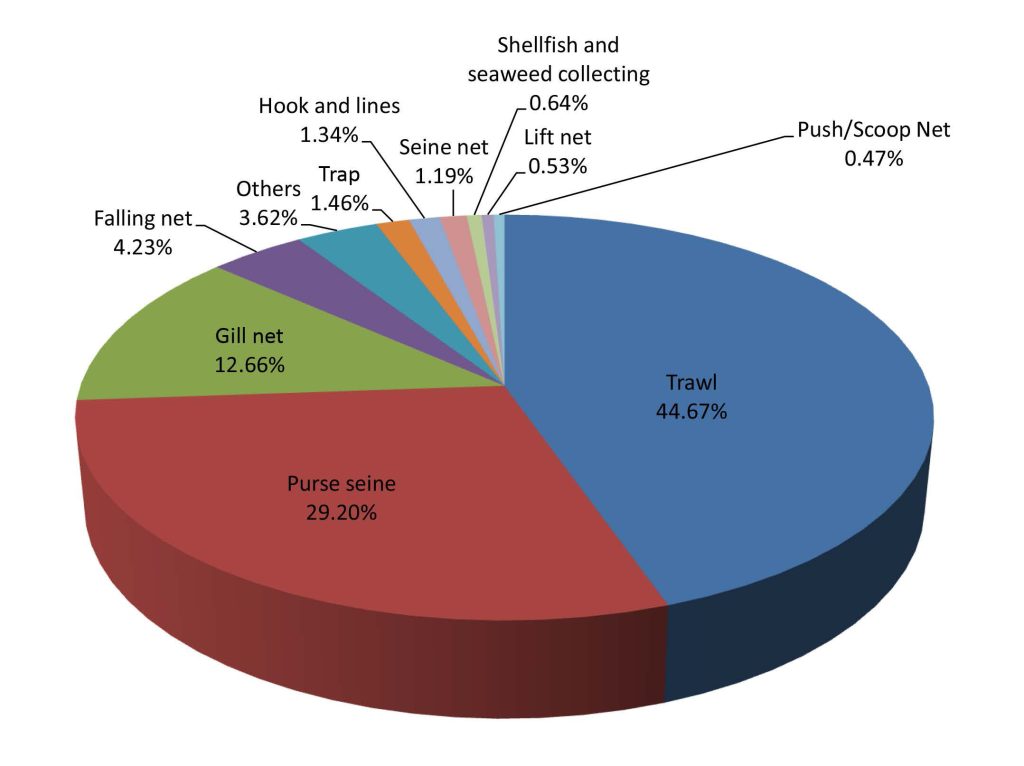
The production from marine capture fisheries of the Southeast Asian region by types of gear is shown in Fig. 9. As the highest producing fishing gear, trawls accounted for about 44.67% of the total production from all types of gears, followed by the purse seines at about 29.20%, gill nets at 12.66%, falling net at 4.23%, others at 3.62%, trap at 1.46%, hook and line at 1.34%, seine nets at 1.19%, shellfish and seaweed collecting at 0.64%, lift net at 0.53%, and push/scoop nets at 0.47%. However, the trend on gear used in marine capture fisheries could not be appropriately analyzed as several countries such as Cambodia, Indonesia, Myanmar, Philippines, and Viet Nam did not provide the relevant information.
Fig 9. Marine capture fishery production by type of gear used in 2016
Number of Fishing Boats by Type
This report covers only the boats that have been registered in each country of Southeast Asia, except for Lao PDR which did not report their respective number of registered fishing boats in 2016. Based on the data available as of 2016, Indonesia had the highest number of boats at 568,329 of which 143,135 were non-powered while 425,194 were powered boats, followed by Cambodia with 103,348 of which 39,726 were non-powered while 63,622 were powered boats. The third highest number was Malaysia with 72,786 of which 23,830 were non-powered and 48,956 powered, followed by Thailand with 40,688 boats, Viet Nam with 300,976 boats, Myanmar with 26,414 boats, Philippines with 6,901 boats, Brunei Darussalam with 1,449 boats, and Singapore with 30 boats.
Number of Fishers by Working Status
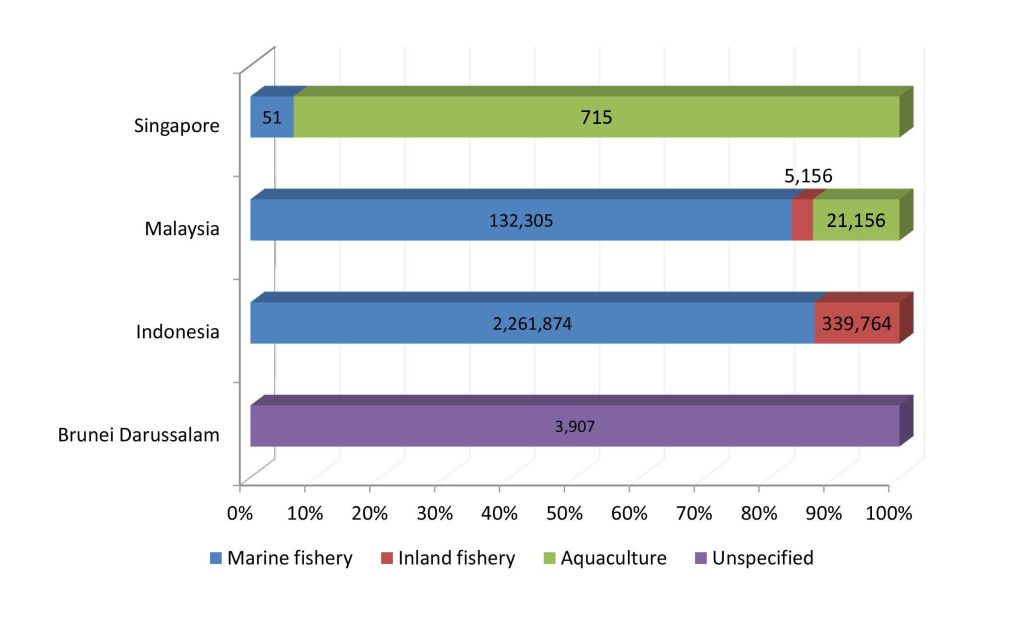
In 2016, Indonesia had the highest number of fishers at 2,601,638 of which 86.9% were involved in marine capture fisheries, and 13.1% in inland capture fisheries. Malaysia had the second highest number of fishers at 158,617 with 83.4% in marine capture fisheries, 3.3% in inland capture fisheries, and 13.3% in the aquaculture sector (Fig. 10). Although minimal, Singapore and Brunei Darussalam also reported their respective numbers of fishers but Cambodia, Lao PDR, Myanmar, Philippines, Thailand, and Viet Nam were not able to provide the information on their respective numbers of fishers.
Efforts to improve data availability and statistics in support of all efforts to compile the data and information should therefore be intensified by encouraging countries to enhance the reporting of small-scale fisheries operations through the conduct of census and surveys using questionnaires. This would enable the countries to compile the necessary data and information on fisheries including the number of fishers and fish farmers as well as on the number of fishing vessels and gear used.
Fig 10. Number of fishers by working status in 2016
Aquaculture Production of Ornamental Fishes
In 2016, only two countries reported their respective production from aquaculture of ornamental fishes: Malaysia and Singapore. While Malaysia reported the highest production comprising mainly the poecilids, cyprinidae, anabantids, characins, callichthyids, and cichilds, Singapore did not report its production by species.
In terms of value, the highest was posted by the cyprinidaes and peocillids at US$ 0.3/pc and US$ 0.2/pc, respectively in Malaysia. Efforts will be made to improve the compilation of data from aquaculture production of ornamental fishes considering that this is a budding industry in the fisheries sector.
Seed Production for Aquaculture
The need to collect information on the volume of seeds produced from the aquaculture industry was recommended in many fora as this factor has a significant role to play in enhancing the economic analysis of the region’s aquaculture industry. Thus, compilation of the said information was initiated by SEAFDEC in 2008 although only four countries responded, namely: Cambodia, Malaysia, Myanmar, and Singapore, by providing the relevant information. Brunei Darussalam joined in 2009 by also giving its data on this aspect. In 2010, Indonesia entered into the picture but information from Brunei Darussalam and Cambodia had faded away.
In 2011 however, Brunei Darussalam, Indonesia, Malaysia, Myanmar, and Singapore provided their respective relevant information, and continued to provide the relevant information until 2016. Nonetheless, only Brunei Darussalam, Cambodia, Malaysia, and Singapore could provide such information as of 2016. Efforts will be exerted to gather the said information from all the Southeast Asian countries for the subsequent issues of this publication, in order that the true picture of this significant niche of the aquaculture industry could be established.
Analysis of Producer Price of Commodities From Capture Fisheries
Although the commodities being harvested by the Southeast Asian countries through capture fisheries varied, the trend of the producer prices was established only for certain species which are commonly caught. Results of the analysis however indicated that the producer prices of several commodities harvested by the countries differ in each country, considering that fish prices are influenced by such factors as demand and supply, as well as cost of production including feeds and transportation, and alternative commodities. In 2016, only Brunei Darussalam, Malaysia, Philippines, Singapore, and Thailand could provide such data and information on the producer price.
For inland fish species, the producer price of common carp, Cyprinus carpio in Malaysia in 2016 was recorded at US$ 1.80/kg while it was US$ 1.42/kg in Thailand. For the Nile tilapia, Oreochromis niloticus the producer price in Malaysia was US$ 1.88/kg compared to Thailand’s US$ 1.70/kg. For other freshwater prawns (Palaemonidae), the producer price in Thailand was US$ 25.50/kg which was quite high.
For marine fish species, the producer price of barramundi (giant sea perch), Lates calcarifer in Brunei Darussalam in 2016 was US$ 6.94/kg compared to Thailand’s US$ 3.97 and Malaysia’s US$ 3.77/kg. Grouper nei, Epinephelus spp. in Singapore cost US$ 8.34/kg in 2016 compared to US$ 5.56/kg in Brunei Darussalam, while leopard coral grouper (Plectropomus maculates) in Brunei Darussalam was US$ 10.71/kg compared to US$ 4.3/kg in Indonesia. Likewise, for the threadfin breams nei (Nemipterus spp.) the producer price in Singapore was US$ 6.61/kg which was much higher than that of Indonesia at US$ 1.33/kg.
Meanwhile, the producer price in 2015 of the false trevally (Lactarius lactarius) in Thailand was US$ 10.22/kg while the lowest was in Malaysia at US$ 4.80/kg. For threadfins, tassel fishes nei (Polynemidae), the producer price in Singapore was US$ 15.21/kg compared to Thailand’s US$ 3.40/kg. For seer fishes nei (Scomberomorus spp.), the producer price in Singapore was US$ 6.08/kg while it was US$ 2.55/kg in Thailand. For golden trevally (Gnathanodon speciosus), the producer price in Brunei Darussalam was US$ 6.94/kg compared to Malaysia’s US$ 2.97/kg. For the Indian mackerel (Rastrelliger kanagurta), the producer price in Brunei Darussalam was US$ 3.47/kg while the lowest price was US$ 1.50/kg in Thailand or an average price of US$ 2.31/kg.
For the giant tiger shrimp, the highest producer price was in the Brunei Darussalam at US$ 11.11/kg while the lowest was US$ 9.42/kg in the Philippines. For banana shrimp (Penaeus merguiensis), the highest price was in Malaysia at US$ 8.21/kg compared to Brunei Darussalam’s US$ 4.17/kg.
For the Indo-Pacific swamp crab (Scylla serrata), the highest price was in Singapore at US$ 11.40/kg with the lowest was in Brunei Darussalam at US$ 3.47/kg for an average of US$ 6.50/kg. As for the common squids nei, Loligo spp., the highest price was US$ 4.84/kg in Singapore while the lowest was in Brunei Darusslam at US$ 1.39/kg with an average of US$ 3.15/kg. As could be gleaned from the abovementioned information, the trends of the producer prices of the same commodities from among the countries in the region generally had very wide variations.

