 SEAFDEC Southeast Asian Fisheries Development Center
OVERVIEW OF THE FISHERIES SECTOR OF SOUTHEAST ASIA IN 2015
Fish and fishery products are becoming more increasingly important as primary sources of protein for many peoples in the world, most especially for those in the Southeast Asian region. Many Southeast Asian countries are among the highest producers of fish and fishery products in the world. This publication is therefore intended to provide the readers with a glimpse of the contribution of Southeast Asia’s fishery and aquaculture production to the world’s food fish basket. Based on the data and statistics provided by the Southeast Asian countries, SEAFDEC compiled and analyzed the necessary information that went into this publication. Of the 11 countries that comprise the Southeast Asian region, namely: Brunei Darussalam, Cambodia, Indonesia, Lao PDR, Malaysia, Myanmar, Philippines, Singapore, Timor-Leste, Thailand, and Viet Nam, only ten countries are covered with this publication in view of the unavailability of fishery statistics and information from Timor-Leste.
Total Fishery Production of Southeast Asia 2015
Table 1. Fishery production by continent from 2011 to 2015 (million MT)
| 2011 | 2012 | 2013 | 2014 | 2015 | |
| World* | 177.3 | 182.4 | 191.1 | 195.7 | 199.7 |
| Africa | 9.3 | 10.1 | 10.1 | 10.5 | 10.8 |
| America | 25.7 | 21.9 | 22.4 | 20.8 | 21.3 |
| Asia** | 91.0 | 93.1 | 100.3 | 103.7 | 104.7 |
| Southeast Asia*** | 33.6 | 39.5 | 40.1 | 42.1 | 44.0 |
| Europe | 16.3 | 16.1 | 16.6 | 16.9 | 17.3 |
| Oceania | 1.4 | 1.5 | 1.4 | 1.5 | 1.6 |
* Source of main data: FAO FIGIS Time Series Query on Fishery Statistical Production
**Excludes Southeast Asia
***Source: Fishery Statistical Bulletin of Southeast Asia (SEAFDEC, 2017)
During the period from 2011 to 2015, fishery production of Southeast Asia (Table 2) exhibited a continuously increasing trend especially in terms of quantity although the increases were quite unstable in terms of value. While the annual average increase from 2011 to 2015 in quantity was 7.2%, the annual average rate of increase in terms of value was about 5.4%. However, some countries were not able to provide the value of their respective fishery production for 2015, for example Viet Nam, Cambodia, and Lao PDR. Nevertheless, the figures still imply that in addition to the increasing quantity, most of the fishery commodities harvested in the region were of high value. By country, Indonesia reported the highest fishery production in 2015 in terms of quantity accounting for about 50.3% of the total fishery production of Southeast Asia, followed by Viet Nam contributing about 14.9% and Myanmar at 12.1%. The Philippines ranked next accounting for 10.6%, Thailand at 5.5%, Malaysia at 4.5%, and Cambodia at 1.7%. Lao PDR, Singapore and Brunei Darussalam contributed the least quantity to the fishery production of Southeast Asia in 2014.
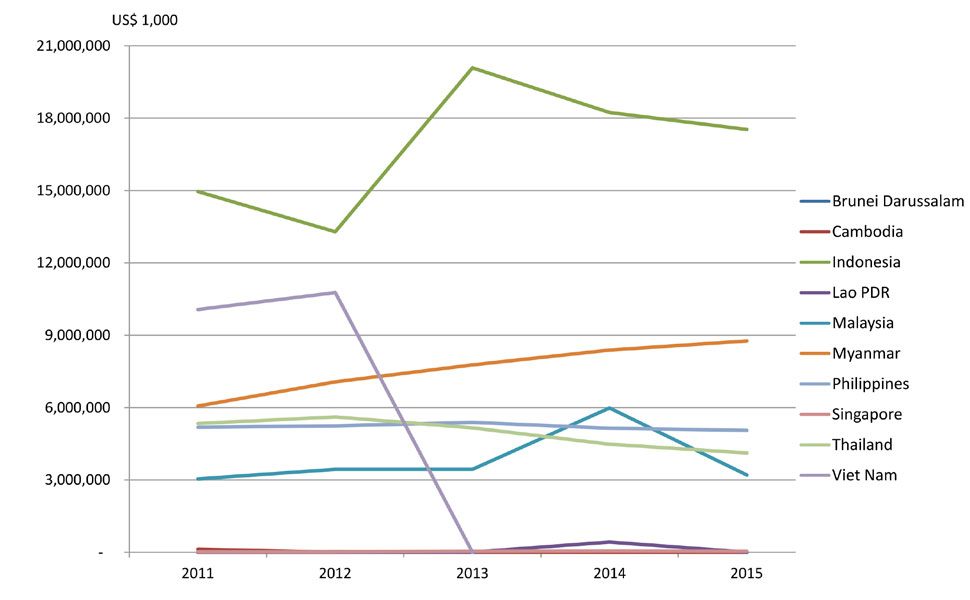
In terms of value, Indonesia accounted for about 45.2% of the total value of the region’s fishery production with Myanmar emerging second contributing about 22.6%, and the Philippines came in third contributing about 13%. Meanwhile, Thailand which came in fourth in terms of quantity and value, contributed about 10.6%, and Malaysia which ranked fifth in terms of production volume as well as value accounted for 8.3%. The trend of the fishery production of the Southeast Asian countries in 2011-2015 is shown in Fig. 1.a and 1.b. The drastic drop in the value of fishery production from Viet Nam does not necessarily mean very low or no value, as it could also indicates the inability of the country to provide the necessary information on time.
Table 2. Total fishery production of Southeast Asia by quantity and value (2011-2015)
| Fishery Production |
2011 | 2012 | 2013 | 2014 | 2015 |
| Quantity (MT) |
39,491,091 | 42,117,647 | 44,814,170 | 41,892,690 | 38,728,905 |
Fig. 1.a Fishery production of the Southeast Asian countries in 2011-2015 by quantity
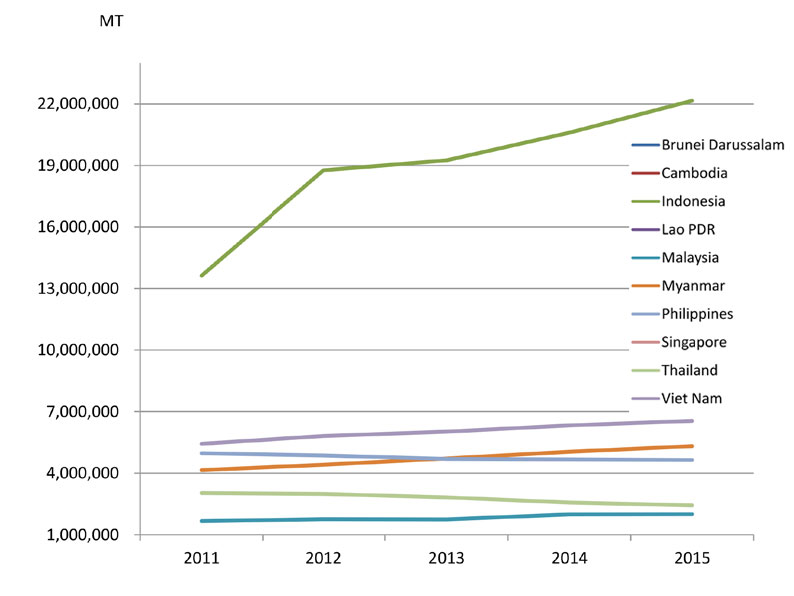
Fig. 1.b Fishery production of the Southeast Asian countries in 2011-2015 by value
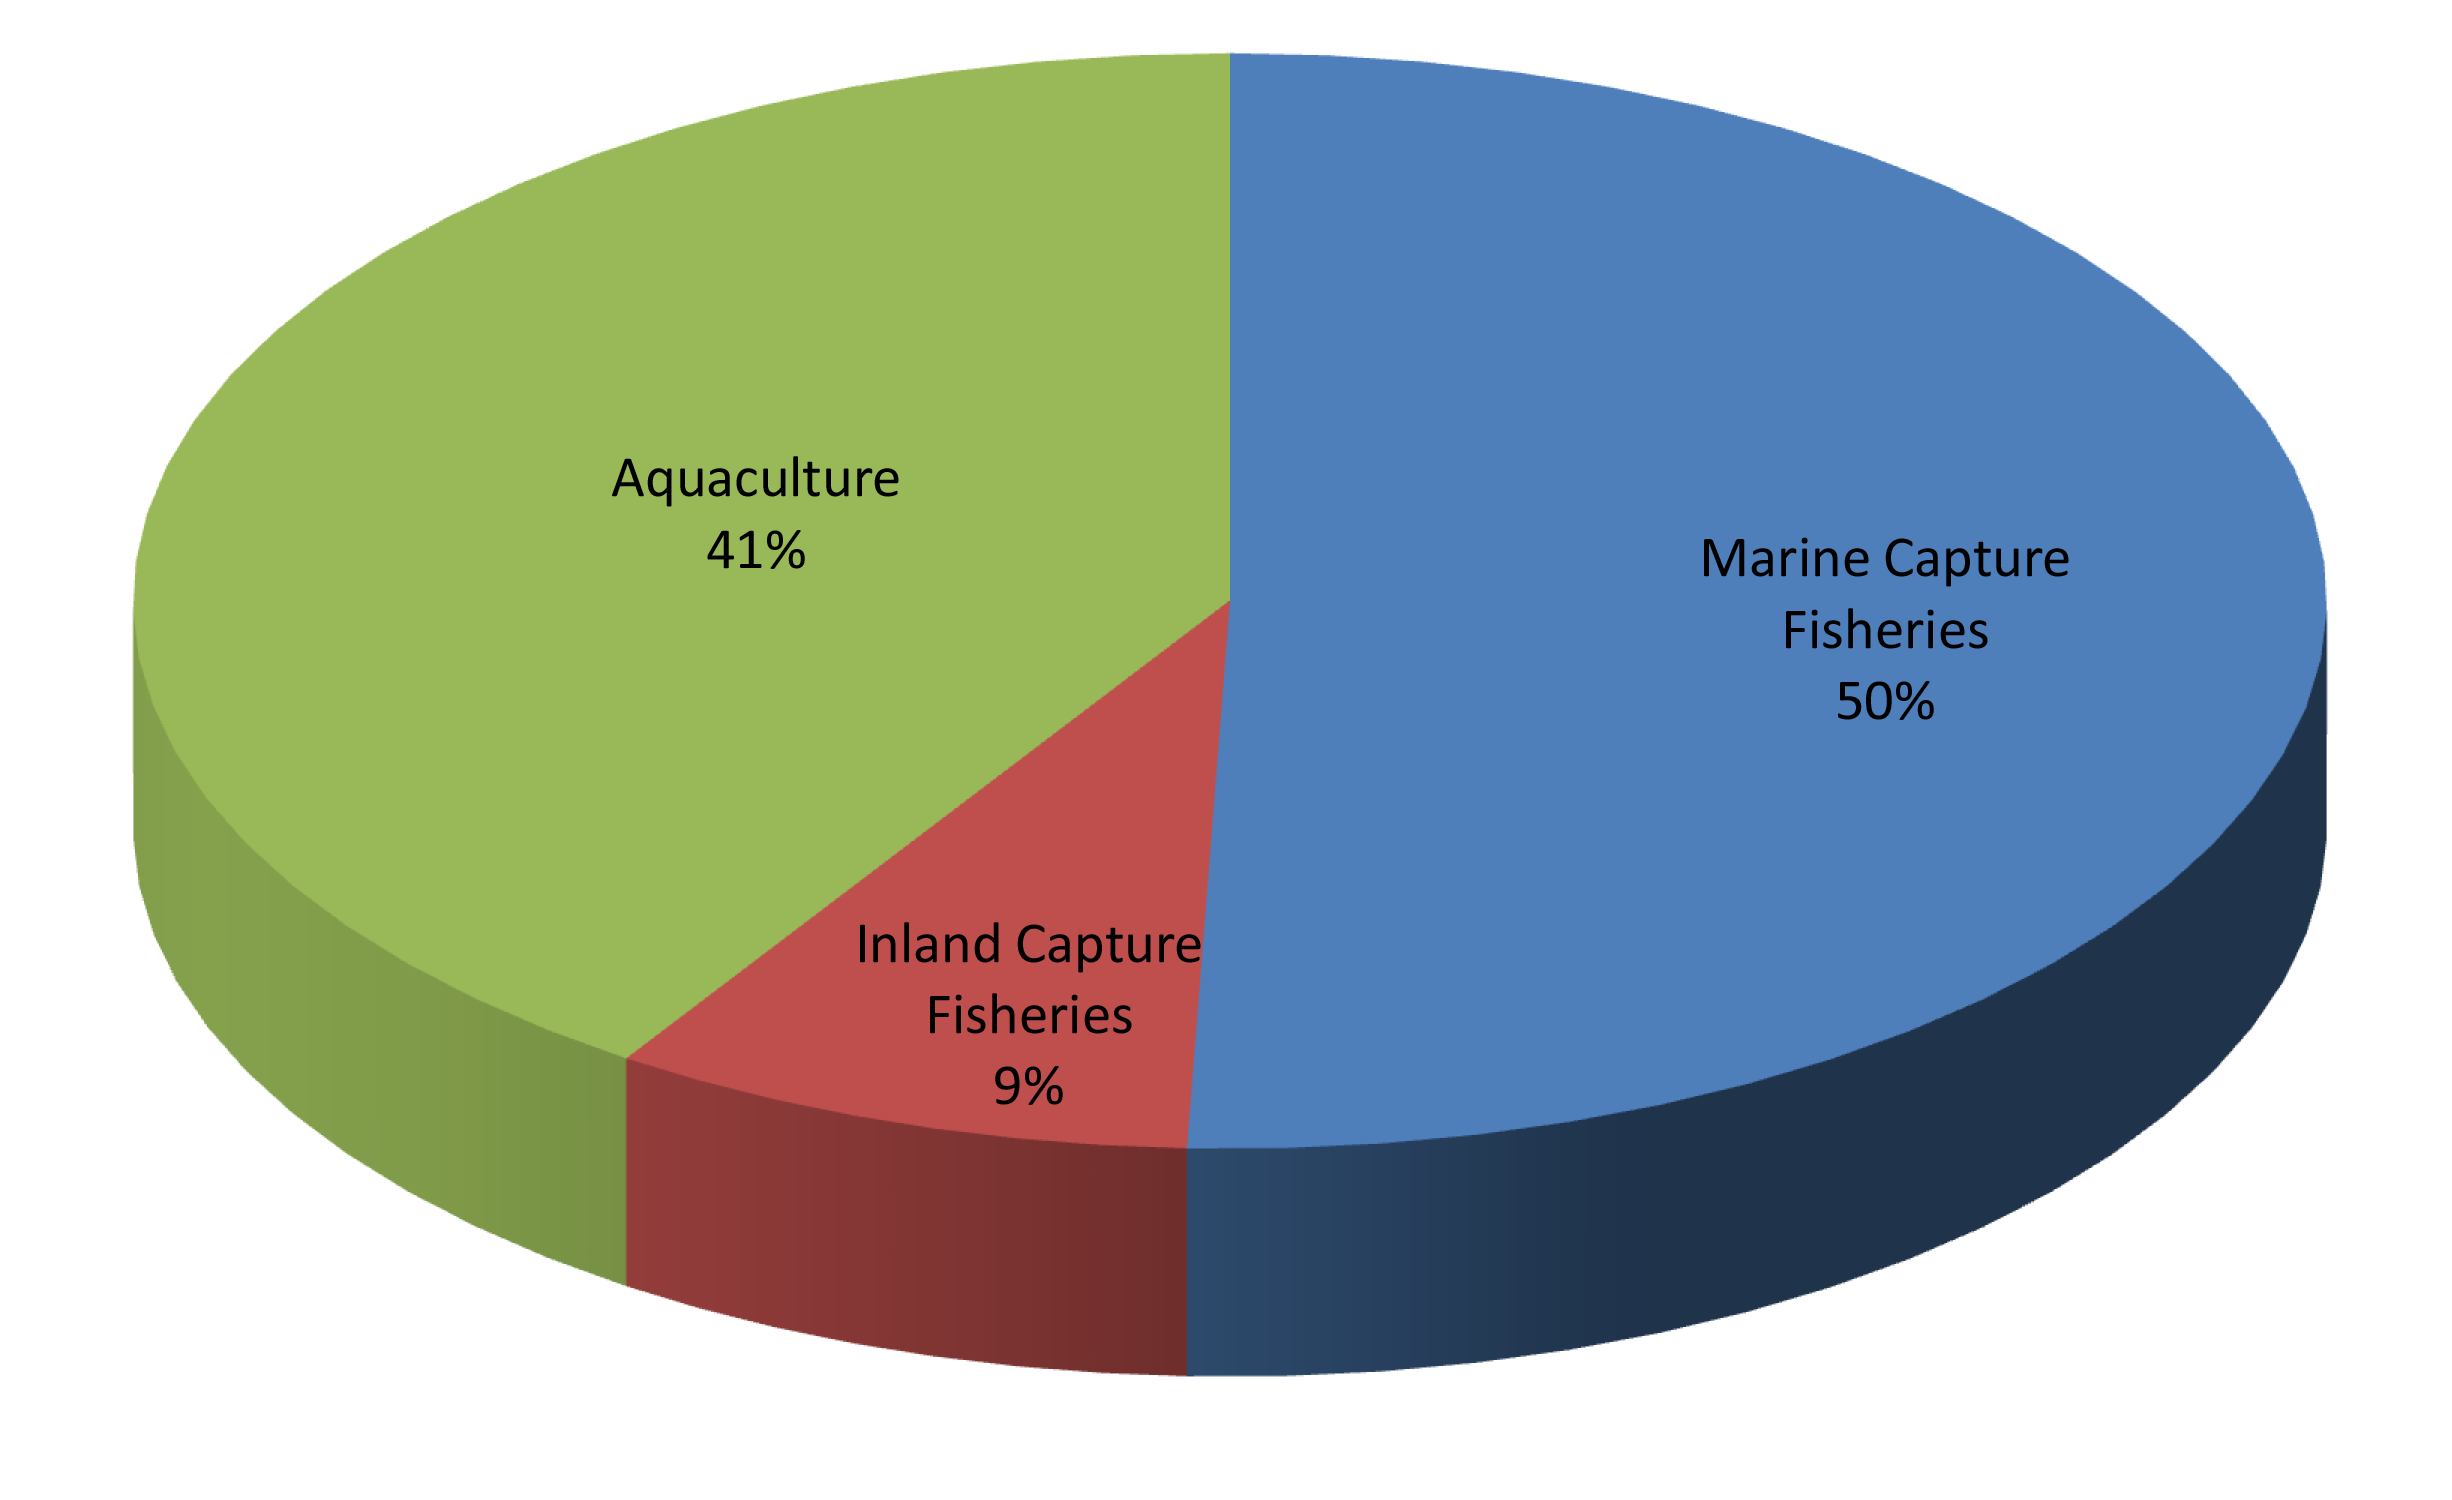
The fishery production of Southeast Asia comes from three sub-sectors, namely: marine capture fisheries, inland capture fisheries, and aquaculture. By sub-sector, the total fishery production of the region in 2015 as shown in Table 3, indicates that the largest portion of the production quantity was derived from aquaculture accounting for approximately 55% followed by marine capture fisheries at about 38% and inland capture fisheries at 7%. In terms of production value, the trend was quite different as marine capture fisheries accounted for 50%, aquaculture at 41%, and inland capture fisheries at 9% (Fig. 2.a and 2.b). While the value per quantity of marine capture fishery products was about US$ 1169/MT, those from inland capture fisheries and aquaculture were about US$ 1523/MT and US$ 770/MT, respectively. This implies that the global market had started to recognize the value of aquatic products harvested through inland capture fisheries, and had been patronizing such products.
Table 3. Fishery production (quantity and value) of Southeast Asia in 2015
| Sub-sector | Quantity (MT) |
Value (US$ 1,000) |
Value/Quantity (US$/MT) |
| Marine capture fisheries | 16,762,392 | 19,481,510 | 1,169 |
| Inland capture fisheries | 3,058,821 | 3,520,590 | 1,523 |
| Aquaculture | 24,177,029 | 15,726,805 | 770 |
| Total | 43,998,242 | 38,728,905 |
Fig. 2.a Contribution of the region’s fisheries sub-sectors to the total fishery production of Southeast Asia in 2015 (by quantity)
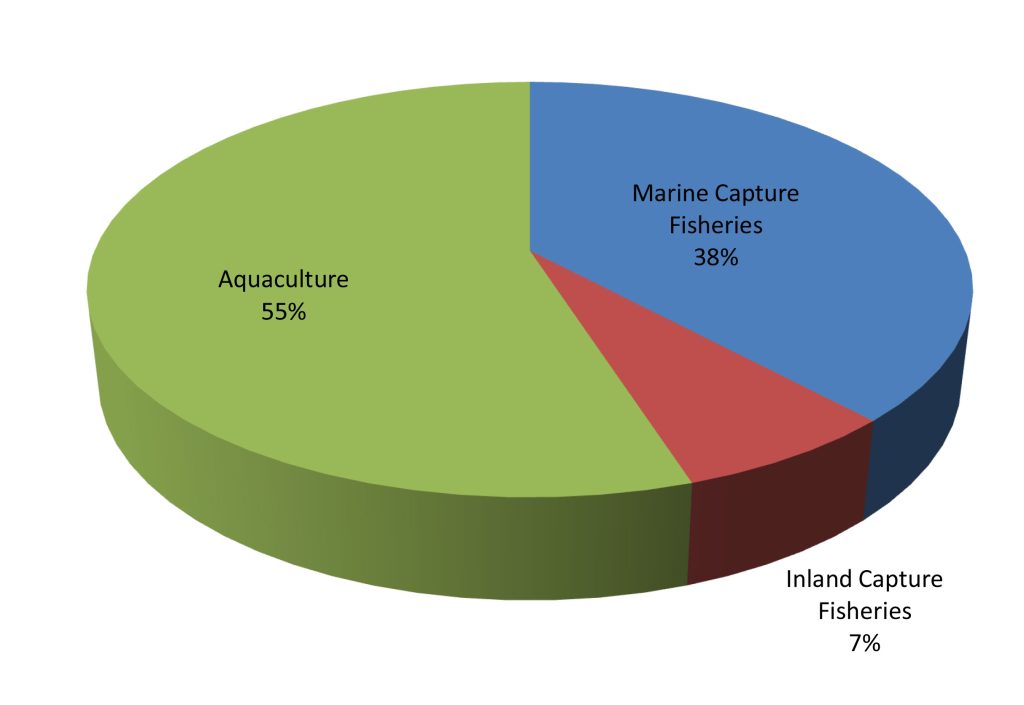
Fig. 2.b Contribution of the region’s fisheries sub-sectors to the total fishery production of Southeast Asia in 2015 (by value)
Marine Capture Fishery Production of Southeast Asia 2015
The region’s production from marine capture fisheries in 2011-2015 had been generally increasing as shown in Table 4. However, in terms of quantity, the annual average increase was only minimal at about 2.7%. While the production value in 2014 had increased slightly by 0.5% compared with that of 2013 after a drop in value from 2011 to 2012, such trend might have been affected by the severe drop in the total production value in 2015 by about 11.2% from 2014, influenced by the steep dive of the production value of Malaysia and Thailand.
Table 4. Marine capture fishery production of Southeast Asia by quantity and value (2011-2015)
| Marine capture fishery production |
2011 | 2012 | 2013 | 2014 | 2015 |
| Quantity (MT) | 15,072,217 | 15,478,831 | 16,137,163 | 16,853,626 | 16,762,392 |
| Value (US$ 1,000) | 21,393,932 | 20,366,636 | 20,585,615 | 21,654,307 | 19,481,510 |
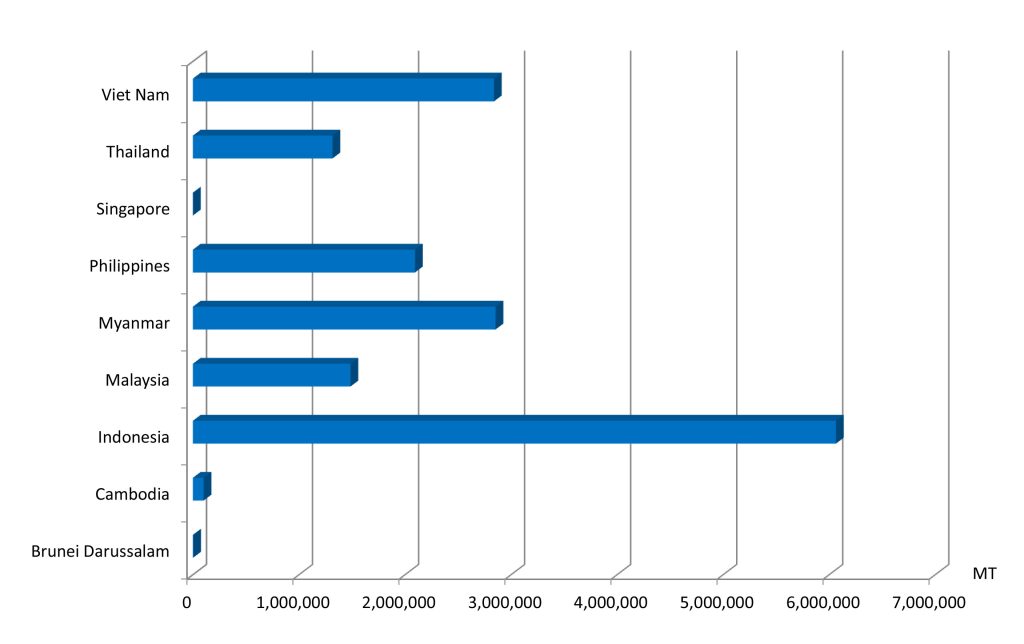
In terms of quantity, the total production from marine capture fisheries of the Southeast Asian countries during 2011-2015 indicated that Indonesia contributed the highest production to the region’s total. Specifically in 2015, Indonesia’s production was 6.06 million MT accounting for approximately 36.2% of the region’s total, followed by Myanmar, Viet Nam, and Philippines at 2.85 million MT (17.0%), 2.84 million MT (16.9%), and 2.09 million MT (12.5%), respectively. Malaysia and Thailand had also produced considerable amount from marine capture fisheries at 1.49 million MT (8.9%) and 1.32 million MT (7.9%), respectively. A picture of the region’s production quantity from marine capture fisheries in 2015 could be gleaned from Fig. 3.
Fig. 3. Marine capture fishery production of Southeast Asia in 2015
Although some Southeast Asian countries were not able to provide the value of their production from marine capture fisheries, the total value of the region’s marine capture fishery production from 2011 to 2015 seemed to have increased corresponding to the increasing trend of the region’s production quantity. By country, Indonesia which led the Southeast Asian countries, accounted for about 41% of the region’s marine capture fishery production value in 2015, with Myanmar emerging second contributing about 25%. Meanwhile, the Philippines which came in third in terms of value contributed about 14%, Malaysia came in fourth at 12%, and Thailand contributed about 8% during the same year.
Aggregating the 2015 production quantity from marine capture fisheries by major commodity groups, marine fishes provided the highest quantity (Table 5) accounting for about 85.4% followed by crustaceans at 3.8% while the mollusks and seaweeds contributed 3.2% and 0.5%, respectively. It should be noted that 7.2% was contributed by other commodity groups which could not be appropriately classified as some countries were not able to provide their respective production quantity by species, e.g. Viet Nam. In 2015, the production quantity of marine fishes and mollusks had slightly decreased from that of 2014 by about 1.9% and 2.9%, respectively, but the production quantity of crustaceans had increased by about 1.9% compared with the corresponding quantity in 2014.
Table 5. Marine capture fishery production of the major commodity groups in Southeast Asia (in MT)
| 2011 | 2012 | 2013 | 2014 | 2015 | |
| Marine fishes | 13,212,957 | 13,430,423 | 14,032,382 | 14,624,488 | 14,310,199 |
| Crustaceans | 599,454 | 637,408 | 656,362 | 627,640 | 636,342 |
| Mollusks | 1,114,730 | 544,584 | 532,871 | 548,348 | 532,192 |
| Seaweed | … | … | … | … | 78,230 |
| Invertebrates | … | … | … | 118,016 | 2,609 |
| Others | 23,233 | … | 915,548 | 935,134 | 1,202,820 |
| Total marine fishery production (MT) |
15,095,450 | 15,590,704 | 16,152,674 | 16,655,092 | 16,762,392 |
Comparing the volume of the total fishery production in 2015 with that of 2014, an increase in production of the marine fishes is obvious, which could have been influenced by various factors that include: Indonesia’s increased production of various major commodities such as skipjack tuna (Katsuwonus pelamis) from fishing area 572 and 711, as well as scad nei (Decapterus spp.), yellowfin tuna (Thunnus albacores), and frigate tuna (Auxis thazard) and production of the stolephorus anchovies; Thailand’s production of major marine fishes that also increased considerably, especially kawakawa (Euthynnus affinis) from fishing areas 572 and 711; and Myanmar’s increased production of marine fishes from fishing area 572.
Moreover, production of the major species of Rastrelliger spp. decreased in 2015 compared with that of 2014 from 816,235 MT to 785,629 MT or 3.7%. Meanwhile, production of crustaceans in 2015 had increased compared with that of 2014, which could have been brought about by Indonesia’s increased production of the marine crustacean nei from fishing areas 572 and 711, and Malaysia’s increased production of Sergestid shrimps nei from fishing area 572.
1 Fishing area 71 covers the marine fishing areas of Thailand (Gulf of Thailand), Cambodia, Viet Nam (Southwest and Southwest), Malaysia (East Coast of Peninsular Malaysia, Sabah, Sarawak), Singapore, Brunei Darussalam, Philippines (Luzon, Visayas, Mindanao), and Indonesia (East Sumatra, North Java, Bali-Nusa Tenggara, South-West Kalimantan, East Kalimantan, South Sulawesi, North Sulawesi, Maluku-Papua)
2 Fishing area 57 covers the marine fishing areas of Myanmar, Thailand (Indian Ocean), Malaysia (West Coast of Peninsular Malaysia), and Indonesia (Malacca Strait, West Sumatra and South Java, Bali-Nusa Tenggara)
The economically-important marine species that provided sizeable contribution to the total fishery production of Southeast Asia from marine capture fisheries (by quantity and value) in 2015 are shown in Table 6. Aside from miscellaneous marine fishes (unidentified) that contributed at 34.59% in quantity and 28.38% in value, production from the tunas group contributed the highest about 12.01% to the total production quantity with the value accounting for about 15.10% of the total production value.
Table 6. Production of economically-important marine species in Southeast Asia (as of 2015)
| Group/species | Quantity (MT) |
Percentage of total quantity of marine capture fishery production (%) |
Value (US$1,000) |
Percentage of total value of marine capture fishery production (%) |
Prices (US$/MT) |
| Tunas Frigate tuna Bullet tuna Kawakawa Skipjack tuna Longtail tuna Albacore tuna Southern bluefin tuna Yellowfin tuna Bigeye tuna |
2,012,981 367,826 |
12.01 |
2,941,086 426,196 47,296 339,537 902,615 141,800 22,860 2,502 819,773 |
15.10 |
1,461 1,231 1,027 1,148 1,209 1,421 2,507 2,254 2,229 |
| Scads Scads nei Bigeye scad Yellowstripe scad Hardtail scad |
1,310,019 766,243 201,214 215,221 118,341 |
7.81
|
1,439,848 795,974 298,929 228,486 116,459 |
7.39 | 1,099 1,039 1,422 1,062 984 |
| Mackerels Scomber mackerels nei Indian mackerels nei Queenfishes nei |
1,034,974 2,295 785,629 247,050 |
6.17 | 1,687,747 1,349 1,105,987 580,411 |
8.66 | 1,631 588 1,408 2349 |
| Anchovies Stolephorus anchovies Other anchovies |
429,510 292,190 102,108 |
2.56
|
394,482 351,483 43,359 |
2.02
|
918 1,203 425 |
The data in Table 6 also suggest that the production value per metric ton of crustaceans group is valued the highest among the commodities harvested through marine capture fisheries at US$ 2659/MT followed by the mollusks group at US$ 1848/MT; Thunnus alalunga (albacore tuna) at US$ 2527/MT; Thunnus obesus (bigeye tuna) at US$ 2379/MT; Scomberomorus spp. (seerfishes nei) at US$ 2349/MT; Thunnus maccoyii (southern bluefin tuna) at 2254/MT; Thunnus albacares (yellowfin tuna) at US$ 2229/MT; Selar crumenophthalmus (bigeye scad) at US$ 1422/MT; Thunnus tonggol (longtail tuna) at US$ 1421/MT; Rastrelliger spp. (other Rastrelliger species) at US$ 1408/MT; Auxis thazard (frigate tuna) at US$ 1231/MT; and Katsuwonus pelamis (skipjack tuna) at US$ 1209/MT. The average value per metric ton of miscellaneous marine fishes (unidentified) which contributed the highest quantity in 2015 was estimated at US$ 954/MT, implying that this group must have generated low-value fishes that possibly include trash fishes.
Inland Capture Fishery Production of Southeast Asia
Southeast Asia’s production from inland capture fisheries from 2011 to 2015 had generally increased and its growth during the same period had been remarkable. The region’s total production from inland capture fisheries in 2015 was 3,058,821 MT accounting for approximately 15% of the region’s total capture fishery production or 7% of the region’s total fishery production. It should be recognized however that the compilation and reporting of production data from inland capture fisheries had been particularly weak and need to be improved. Thus, the data so far reported could be insufficient in terms of species composition. It should also be considered that in the real situation, the catch of rural community members comprising the main users of the inland resources, is consumed locally and is usually not reported in local or national statistics. Accordingly, the data on the total catch from inland capture fisheries in this publication could be considered as indicative only.
While countries reported their respective data on production from inland capture fisheries during 2011-2015, only six countries, namely: Brunei Drussalam, Indonesia, Malaysia, Myanmar, Philippines, and Thailand reported their corresponding production values. Thus, the actual regional production trend of the inland capture fisheries sub-sector could not be established. At any rate, as the consistent top producer, Myanmar maintains a stable inland fishery production from 2011 to 2015 that accounted for 33.9% of the country’s total production from capture fisheries, 27.5% of the country’s total fishery production, and 3.3% of the region’s total fishery production (Table 7).
Table 7. Contribution of Southeast Asian countries’ inland capture fisheries to the region’s total fishery production in 2015
| Country | Inland capture production (MT) |
Total capture production (MT) |
% of inland capture production to total capture production |
Total fishery production (MT) |
% of inland capture fishery production to total fishery production |
| Brunei Darussalam |
0.02 | 3,370.02 | 0.06 | 4,353.02 | 0.05 |
| Cambodia | 487,905 | 588,889 | 82.85 | 731,889 | 66.66 |
| Indonesia | 455,270 | 6,520,330 | 6.98 | 22,154,423 | 2.05 |
| Lao PDR | 62,635 | 62,635 | 100 | 158,600 | 39.49 |
| Malaysia | 5,924 | 1,491,974 | 0.40 | 1,998,439 | 0.30 |
| Myanmar | 1,463,120 | 4,317,320 | 33.89 | 5,316,950 | 27.52 |
| Philippines | 203,366 | 2,297,712 | 8.85 | 4,645,871 | 4.37 |
| Singapore | … | 1,265 | … | 8,161 | … |
| Thailand | 184,101 | 1,501,318 | 12.26 | 2,429,856 | 7.58 |
| Viet Nam | 196,500 | 3,036,400 | 6.47 | 6,549,700 | 3.00 |
| Total | 3,058,821 | 19,821,213 | 15.43 | 42,998,242 | 7.11 |
The second highest producer, Cambodia reported production quantity of 487,905 MT in 2015 that represented 82.8% of the country’s production from capture fisheries, 66.7% of the country’s total fishery production, and 1.1% of the region’s total fishery production. However, such production quantity could not be confirmed as accurate considering that the country needs to improve its systems of collecting and compiling the fishery statistics, especially with regards to the production from inland capture fisheries.
Only four countries, namely: Brunei Darussalam, Indonesia, Philippines, and Thailand, had provided their respective production data from inland capture fisheries by species, while the other countries were not able to report due to inadequacy of expertise in identifying the catch by species. Capacity building in this aspect is therefore necessary to enable the countries to compile their respective inland fishery production by major groups of species. Thus, production from inland capture fisheries of Myanmar, Malaysia, Lao PDR, Cambodia and Viet Nam in 2015 could not be analyzed in terms of species since species breakdown was not reported. Production of Indonesia, as the region’s third highest producer, was made up mainly of the striped snakehead (Chana striata) which accounted for about 8.9% of the country’s total production from inland capture fisheries.
Next to miscellaneous fishes which provided the highest production from inland capture fisheries accounting for 78.8% of the region’s total inland fishery production in 2015 (Table 8), striped snakehead gave the second highest production at 2.2% followed by freshwater mollusks at 2.0%, Tilapias nei (Oreochromis = Tilapia spp.) at 1.65%, Nile tilapia (Oreochromis niloticus) at 1.61, snakeskin gourami (Trichogaster pectoralis) at 1.15%. Although the current reported production of the giant river prawn (Macrobrachium rosenbergii) was relatively low at 14,770 MT, its value per metric ton of production was the highest at US$ 3824/MT followed by the Asian redtail catfish at US$ 2182/MT and striped snakehead at US$ 2045/MT.
Table 8. Production of major inland fisheries species in Southeast Asia in 2015
| Common name | Quantity (MT) |
Percentage total quantity of major inland species to total inland capture production (%) |
Value (US$ 1,000) |
Percentage total value of major inland species to total inland capture production (%) |
Price (US$/MT) |
| Misc. fishes | 2,409,370 | 78.77 | 2,530,104 | 71.9 | 1,050 |
| Striped snakehead | 67,237 | 2.20 | 137,515 | 3.9 | 2,045 |
| Freshwater mollusks nei | 58,620 | 1.92 | 7,457 | 0.21 | 127 |
| Tilapias nei | 50,474 | 1.65 | 66,595 | 1.89 | 1,319 |
| Nile tilapia | 49,139 | 1.61 | 72,529 | 2.06 | 1,476 |
| Snakeskin gourami | 35,338 | 1.15 | 32,921 | 0.93 | 932 |
| Torpedo-shaped catfishes nei |
34,378 | 1.12 | 49,644 | 1.41 | 1,444 |
| Silver barb | 33,849 | 1.11 | 41,531 | 1.18 | 1,227 |
| Cyprinids nei | 30,688 | 1.00 | 30,913 | 0.88 | 1,007 |
| Asian redtail catfish | 28,040 | 0.92 | 61,187 | 1.74 | 2,182 |
| Climbing perch | 27,737 | 0.91 | 45,130 | 1.28 | 1,627 |
| Giant river prawn | 14,770 | 0.48 | 56,479 | 1.60 | 3,824 |
Aquaculture Production of Southeast Asia
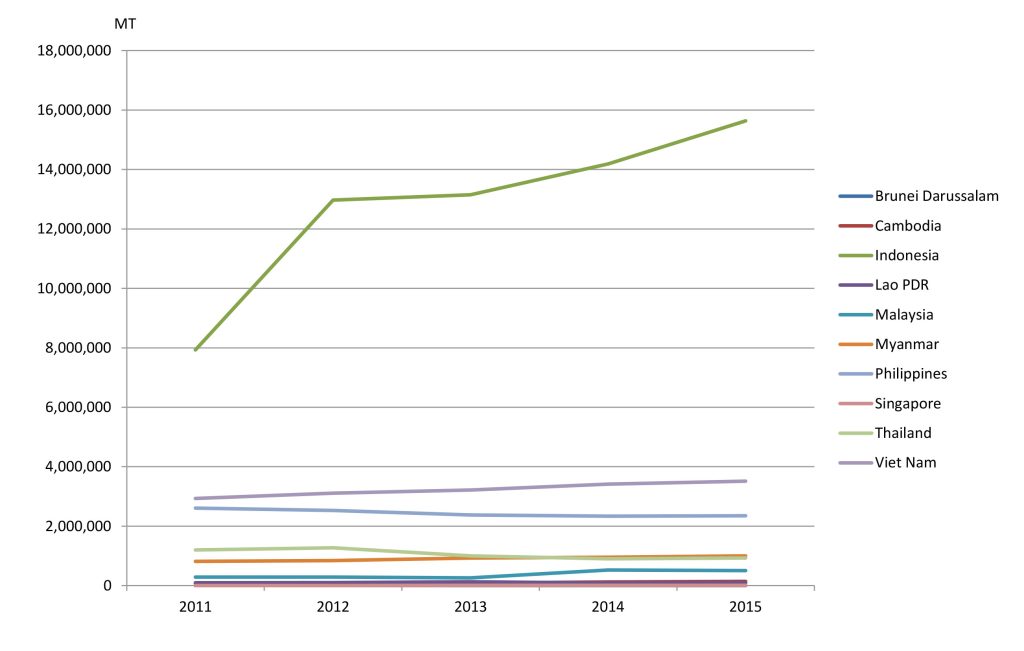
In 2015, the region’s total production from aquaculture accounted for about 54.9% of the region’s total fishery production in terms of quantity and 40.6% in terms of value. From 2011 to 2015, Southeast Asia’s total production from aquaculture steadily increased at about 11.6% per year (Fig. 4), the highest annual increase of about 32.9% was recorded between 2011 and 2012, which could have been brought about by the sudden rise in the aquaculture production of Indonesia during the same period that also continued to increase until 2015. While the aquaculture production of Lao PDR, Philippines, Singapore, and Thailand had been slightly decreasing from 2013, production from aquaculture of the other Southeast Asian countries continued to increase, except those of Malaysia that decreased a little during 2015.
Production of Eucheuma seaweeds nei ( Eucheuma spp.) of Indonesia, as the largest producer from aquaculture in 2015, contributed 64.7% in terms of production quantity and 8.6% in production value to the country’s aquaculture production. This was followed by Gracilaria seaweeds nei (Gracilaria spp.) accounting for 7.4%, Nile tilapia (Oreochromis niloticus) at 6.9%, torpedo-shaped catfishes (Clarias spp.) at 4.6%, and milkfish (Chanos chanos) at 4.0%. In the case of Viet Nam, as the second highest producer from aquaculture, 70.0% of its aquaculture production came from freshwater fishes nei (Osteichthyes) followed by giant river prawn (Macrobrachium rosenbergii) which accounted for 16.1% of the country’s aquaculture production. For the Philippines as the third highest producer from aquaculture, its main aquaculture product is the elkhorn sea moss (Kappaphycus alvarezii) contributing 62.1% to the country’s production from aquaculture followed by milkfish (Chanos chanos) accounting for 16.4%, Nile tilapia (Oreochromis niloticus) at 7.0%, spiny Eucheuma (Eucheuma denticulatum) at 4.5%. For Myanmar, its main production from aquaculture is roho labeo (Labeo rohita) which accounted for 62.0% of the country’s production from aquaculture followed by mrigal carp (Cirrhinus mrigala) accounting for 6.9%, catla (Catla catla) accounting for 6.5%, giant tiger shrimp (Penaeus monodon) at 5.0%, and tilapias nei (Tilapia spp.) at 3.2. Thailand’s main aquaculture product is the whiteleg shrimp (Penaeus vannamei) accounting for 30.4% of the country’s production from aquaculture followed by Nile tilapia (Oreochromis niloticus) at 22.2%, green mussel (Perna viridis) at 12.%, hybrid catfishes (C. gariepinus x C. macrocephalus) at 12.3%.
In terms of value per quantity of aquaculture production in 2015, Brunei Darussalam attained the highest average value at US$ 6272/MT followed by Singapore at US$ 4244/MT, Thailand at US$ 2,511/MT, Myanmar at US$ 1,644/MT, Malaysia at US$ 1,589/MT, Philippines at US$ 909/MT, and Indonesia at US$ 561/MT. Meanwhile, the value per quantity of aquaculture production of Cambodia, Lao PDR, and Viet Nam in 2015 could not be calculated as these countries did not report their respective total production values.
Fig 4. Trend of the aquaculture production of the Southeast Asian countries from 2011 to 2015 (MT)
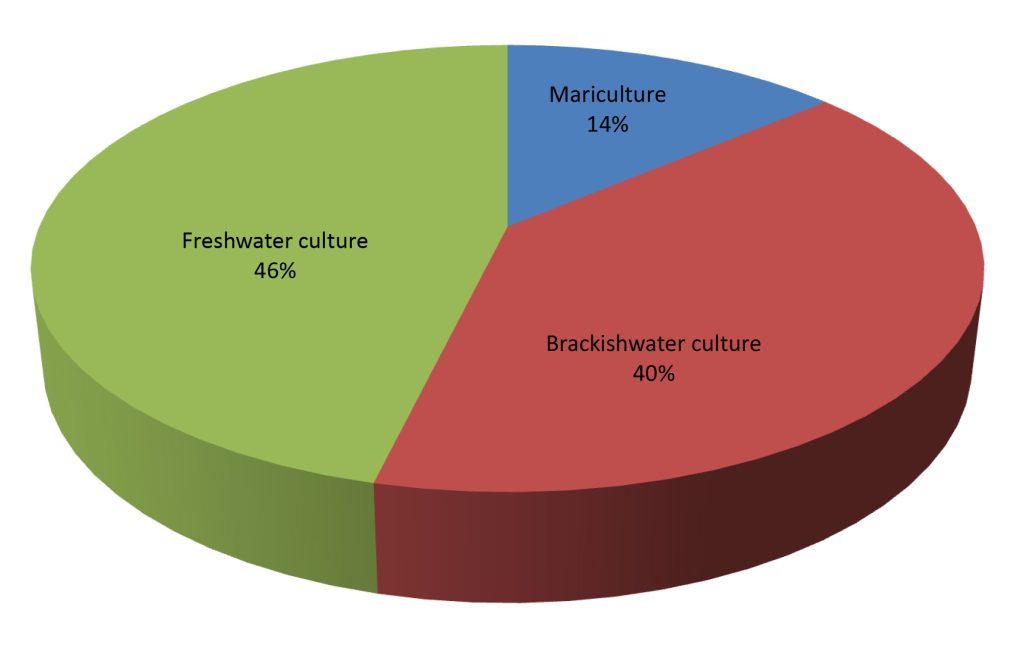
The aquaculture production comes from three environments, namely: marine, brackishwater, and freshwater. In terms of quantity, aquaculture in marine areas or mariculture provided 54.0% to the region’s total aquaculture production in 2015 while culture in brackishwater areas or brackishwater culture contributed 13.0%, and the remaining 33.0% came from freshwater culture (Fig. 5a and 5b). In terms of value, freshwater culture production contributed the highest at 46.0% followed by brackishwater production at 40.0% and mariculture production at 14.0%.
Fig. 5a. Production by the aquaculture sub-sectors in 2015 (by quantity)
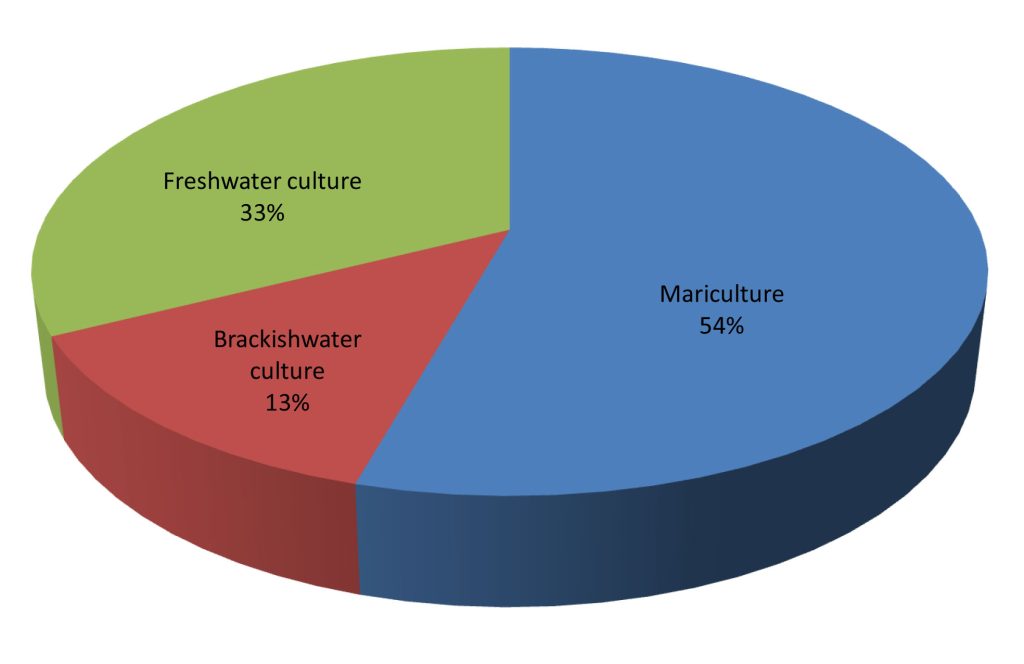
Fig. 5b. Production by the aquaculture sub-sectors in 2015 (by value)
It should be recalled that in 2014, production from mariculture accounted for 53.0% of the total aquaculture production in terms of quantity, while brackishwater culture production accounted for 14.0% and freshwater culture production at 33.0%. In terms of value, mariculture contributed 17.0% to the region’s total aquaculture production value, brackishwater culture production at 40.0%, and freshwater culture production at 43.0%. This means that in 2015, the production value from mariculture increased by 10.7% from that of 2014 which could be due to the increased production of miscellaneous fishes nei in Viet Nam. While production from brackishwater culture in 2015 compared with that of 2014 increased by 2.7%, but the production value from freshwater culture decreased by 3.8%which could be due to the inability of some countries to report their respective production values e.g. Lao PDR.
Mariculture
In 2015, the region’s total production from mariculture contributed about 54.3% to the region’s total production in terms of quantity and 13.8% in terms of value. Farmed aquatic plants contributed 91.0% to the region’s total quantity of mariculture production, such as the spiny Eucheuma (Eucheuma denticulatum), Eucheuma seaweeds nei ( Eucheuma spp.), Caulerpa seaweeds (Caulerpa spp.), and the elkhorn sea moss (Kappaphycus alvarezii). Production of Eucheuma seaweeds (Eucheuma spp.) mainly from Indonesia accounted for 77.0% of the region’s total production quantity from mariculture, followed by the elkhorn sea moss (Kappaphycus alvarezii) the main products of the Philippines which accounted for 11.1%, green mussel (Perna viridis) and blood cockle (Anadara granosa) mainly produced by Thailand at 0.9% and 0.5%, respectively. Shrimps, mainly produced by Viet Nam, contributed 0.5%, spiny Eucheuma (Eucheuma denticulatum) mainly produced by the Philippines at 0.8%, and oysters group mainly produced by the Philippines and Thailand at 0.3% (Fig. 6a).
In terms of value, Eucheuma seaweeds (Eucheuma spp.) contributed 34.9% to the region’s total mariculture production value followed by elkhorn sea moss (Kappaphycus alvarezii) contributed 21.0%, shrimp at 14.4%, and marine fishes accounting for 13.1%. In addition, blood cockle (Anadara granosa) 4.4%, green mussel (Perna viridis) at 1.5%, and oysters at 1.1%, to the total value of the region’s mariculture production (Fig. 6b). Moreover, shrimps earned the highest value per quantity at US$ 6250/MT followed by marine fishes at US$ 2353/MT, while the lowest value was obtained from the spiny Eucheuma at US$ 73/MT (Table 9).
Fig 6a. Production of major species from mariculture in 2015 (by quantity)
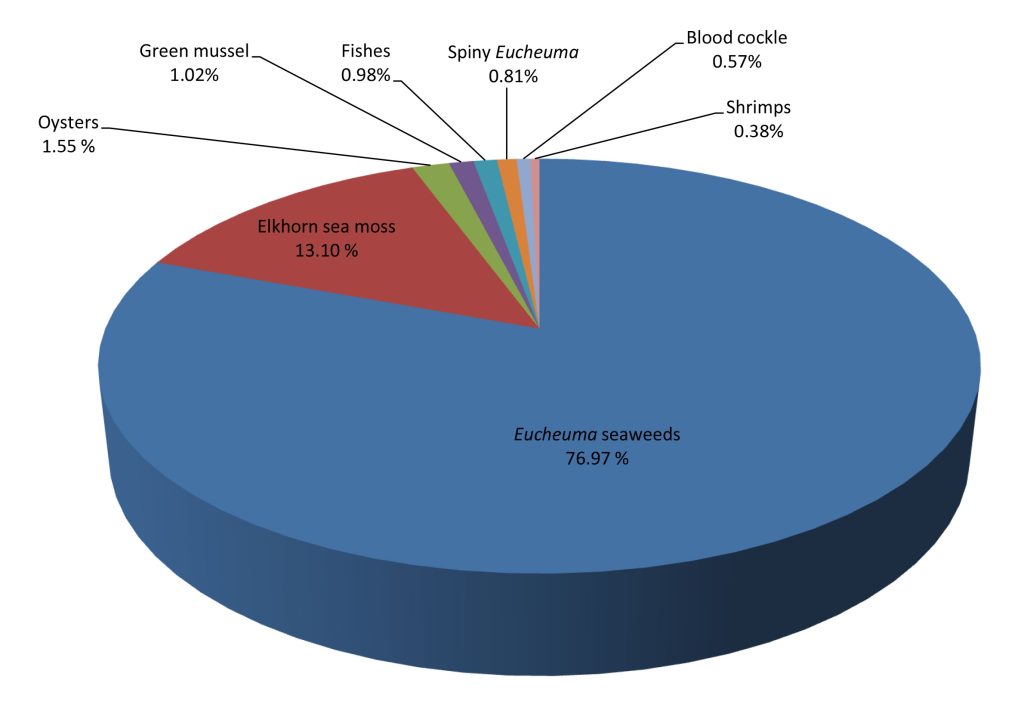
Fig 6b. Production of major species from mariculture in 2015 (by value)
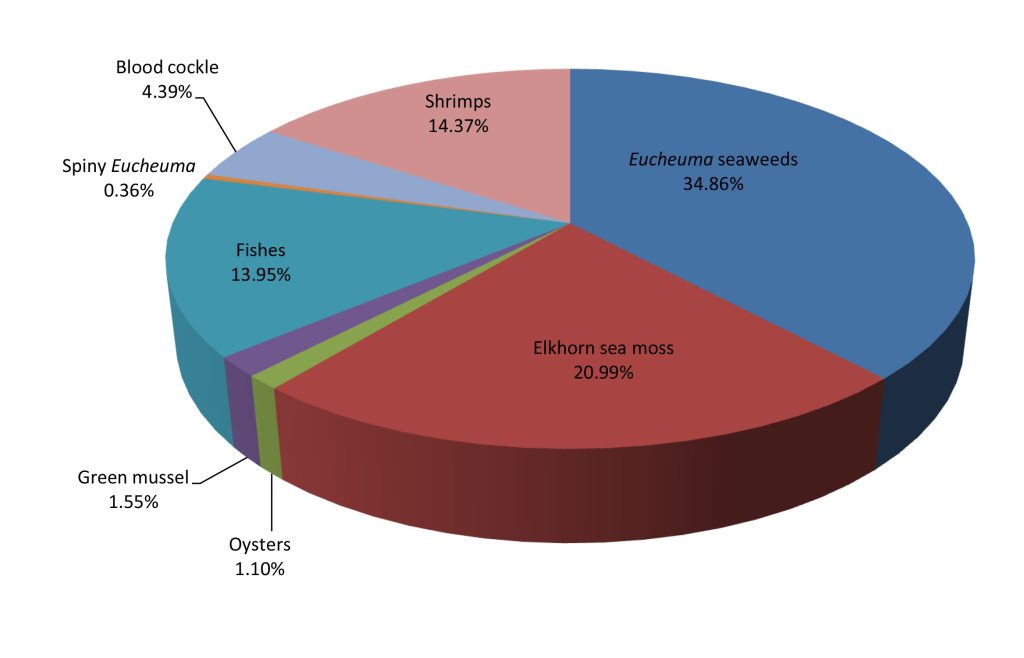
Table 9. Production of major mariculture species in Southeast Asia (as of 2015)
| Common name | Quantity (MT) |
Percentage production of major commodities from mariculture to total mariculture production (%) |
Value (US$ 1,000) |
Percentage total value of major commodities production from mariculture to total mariculture value (%) |
Price (US$/MT) |
| Eucheuma seaweeds | 10,112,107 | 76.97 | 756,301 | 34.86 | 74 |
| Elkhorn sea moss | 1,720,949 | 13.10 | 455,462 | 20.99 | 265 |
| Oysters | 203,999 | 1.55 | 23,779 | 1.10 | 581 |
| Green mussel | 134,072 | 1.02 | 33,596 | 1.55 | 251 |
| Fishes | 128,671 | 0.98 | 302,712 | 13.95 | 2,353 |
| Spiny eucheuma | 106,950 | 0.81 | 7,861 | 0.36 | 73 |
| Blood cockle | 74,761 | 0.57 | 95,274 | 4.39 | 1,274 |
| Shrimps | 49,891 | 0.38 | 311,818 | 14.37 | 6,250 |
For the value per quantity of mariculture production in 2015, Brunei Darussalam posted the highest at an average of US$ 5363/MT from its production of the highly economical species of giant sea perch (Lates calcarifer), followed by Myanmar at US$ 6007/MT for its shrimp production, and Singapore at US$ 3807/MT for its production of milkfish (Chanos chanos). Meanwhile, the mariculture production value per quanity of Thailand was at US$ 707/MT, Philippines at US$ 339/MT, Malaysia at US$ 156/MT, and Indonesia at US$ 93/MT.
Brackishwater Culture
The total production from brackishwater culture in 2015 represented about 13.0% of the region’s total production from aquaculture (Fig. 7a and 7b). Production of Gracilaria seaweeds (Gracilaria spp.) mainly produced by Indonesia had the highest quantity representing 36.3% of the region’s total production from brackishwater culture. The second highest was contributed by milkfish (Chanos chanos) at 31.6% main contributed by Indonesia and the Philippines, and the third came from Penaeid shrimps nei (Penaeus spp.) at 20.5% mainly contributed by Indonesia and Viet Nam. Whiteleg shrimps (Penaeus vannamei) at 10.6% mainly contributed by Thailand, miscellaneous fishes provided 2.2%, and giant tiger shrimp (Penaeus monodon) at 2.1% main contributed by the Philippines. In terms of value, the highest was provided by the Penaeid shrimps nei (Penaeus spp.) with Indonesia contributing the highest value at 35.7%, followed by whiteleg shrimp (Penaeus vannamei) with Malaysia and Thailand contributing the highest value at 24.2%, marine fishes at 17.4%, milkfish (Chanos chanos) produced by the Philippines at 12.2%, and giant tiger shrimp (Penaeus monodon) from Philippines, Thailand, and Malaysia at 9.7%.
Fig 7a. Production of major brackishwater culture species in 2015 (by quantity)
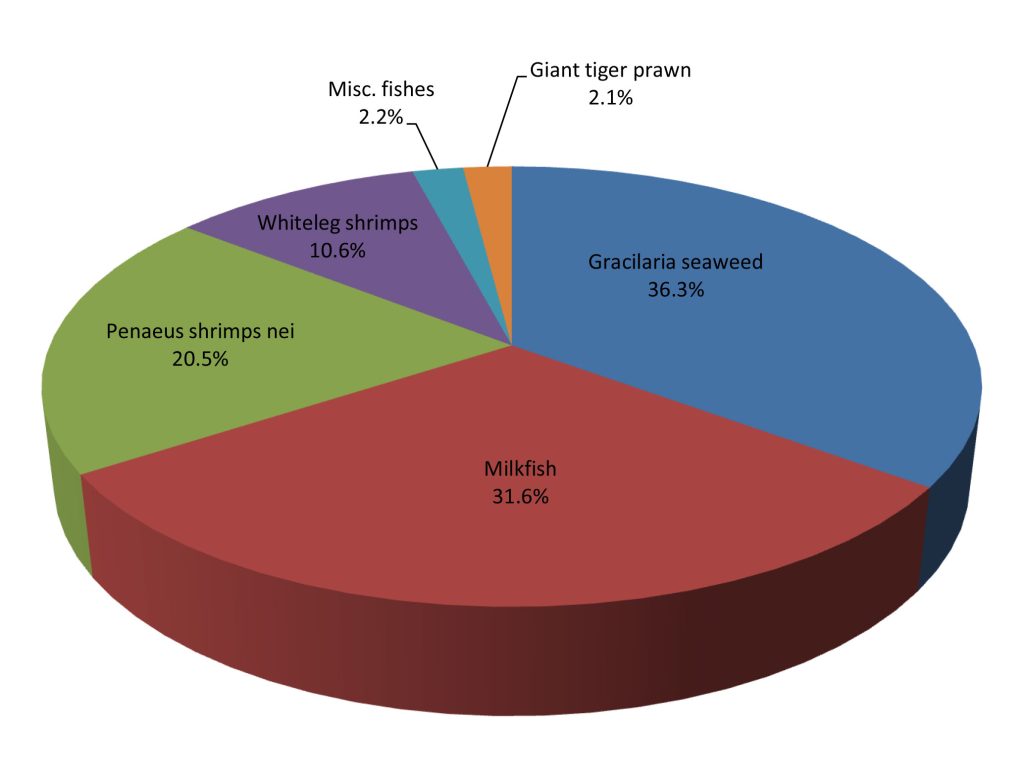
Fig 7b. Production of major brackishwater culture species in 2015 (by value)
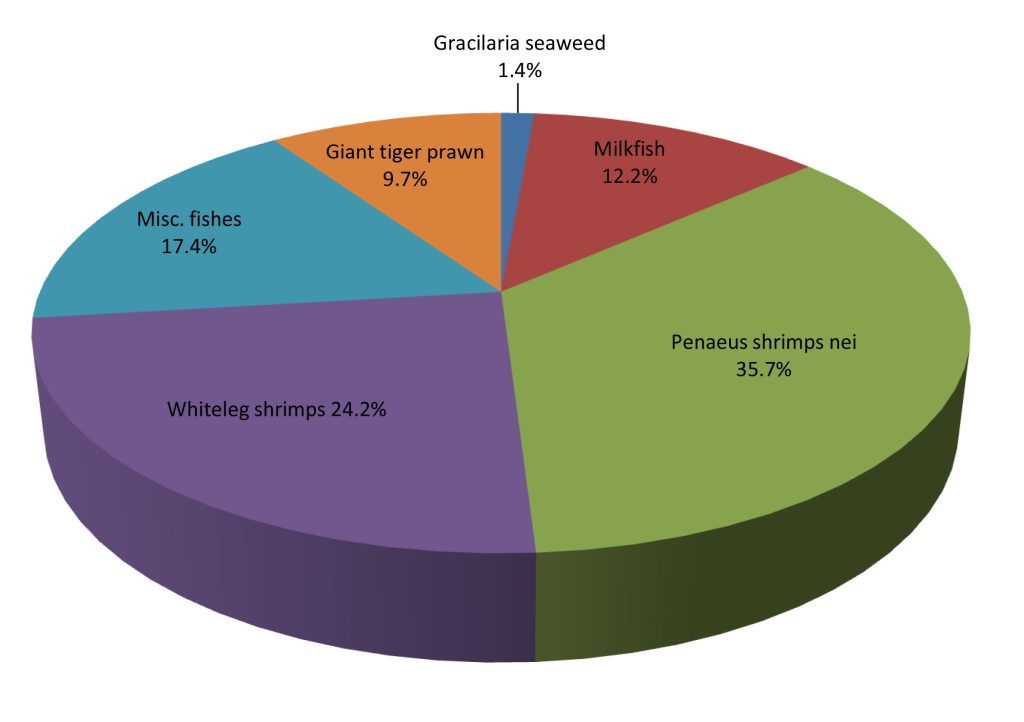
In terms of average value per quantity of production from brackishwater culture, considering only the countries that reported their respective production value, Singapore posted the highest at US$ 12456/MT, followed by Brunei Darussalam at US$ 6523/MT, Malaysia at US$ 4787/MT, Thailand at US$ 4636/MT, Philippines at US$ 3936/MT, and Indonesia at US$ 167/MT. Cambodia and Viet Nam did not report their respective production from brackishwater aquaculture in terms of quantity and value. The highest value per quantity of production was attained by the giant tiger shrimp at US$ 9235/MT followed by marine fishes at US$ 5648/MT, whiteleg shrimps at US$ 4496/MT, Penaeus shrimps nei at US$ 3442/MT, while gracilaria seaweed obtained the lowest at US$ 75/MT (Table 10).
Table 10. Production of major brackishwater species in Southeast Asia (as of 2015)
| Common name | Quantity (MT) |
Percentage brackishwater culture production of major commodities to total brackishwater culture production (%) |
Value (US$ 1,000) |
Percentage total value of major commodities production from brackishwater culture to total brackishwater culture value (%) |
Price (US$/MT) |
| Gracilaria seaweed | 1,157,561 | 36.3 | 86,583 | 1.4 | 75 |
| Milkfish | 1,009,876 | 31.6 | 766,636 | 12.2 | 1,994 |
| Penaeid shrimps nei | 652,803 | 20.5 | 2,247,000 | 35.7 | 3,442 |
| Whiteleg shrimp | 338,696 | 10.6 | 1,522,613 | 24.2 | 4,496 |
| Misc. fishes | 68,965 | 2.2 | 1,093,252 | 17.4 | 5,648 |
| Giant tiger prawn | 65,931 | 2.1 | 608,894 | 9.7 | 9,235 |
Freshwater Culture
The region’s total production from freshwater culture in 2015 accounted for about 33.0% of the region’s total production from aquaculture, an increase of about 3.8% from that of the 2014. In 2015, Viet Nam was the highest producer from freshwater aquaculture contributing about 40.2% of the region’s total production from freshwater culture, followed by Indonesia at 34.6%, Myanmar at 12.0%, Thailand at 5.3%, Philippines at 3.4%, Cambodia at 1.8%, Malaysia at 1.4%, and Lao PDR at 1.2%.
Accounting for 46.0% of the region’s total aquaculture production value in 2015, the freshwater culture sub-sector seems to have emerged as a very important fisheries sub-sector. This is considering that its production value in 2015 had slightly decreased by almost 2.2% compared with that of 2014, although this information could be underestimated due to the missing corresponding production values from Cambodia, Lao PDR, and Viet Nam.
In terms of production quantity from freshwater culture by species (Fig 8a and 8b), miscellaneous freshwater fishes accounted for 34.6% of the region’s total production from freshwater culture, which was mainly contributed by Viet Nam. This was followed by Nile tilapia (Oreochromis niloticus) which accounted for 18.6% and contributed mainly by Indonesia, Thailand, and the Philippines, and Torpedo-shaped catfish (Clarias spp.) followed at 10.0% contributed mainly by Indonesia, roho labeo (Labeo rohita) came in next at 7.9% contributed mainly by Myanmar, giant river prawn (Macrobrachium rosenbergii) at 7.5% mainly contributed by Viet Nam, common carp (Cyprinus carpio) accounted for 6.2% contributed by Indonesia, and pangas catfishes nei (Pangasius spp.) at 4.8% mainly contributed by Indonesia.
Fig. 8a. Production of major freshwater culture species in 2015 (by quantity)
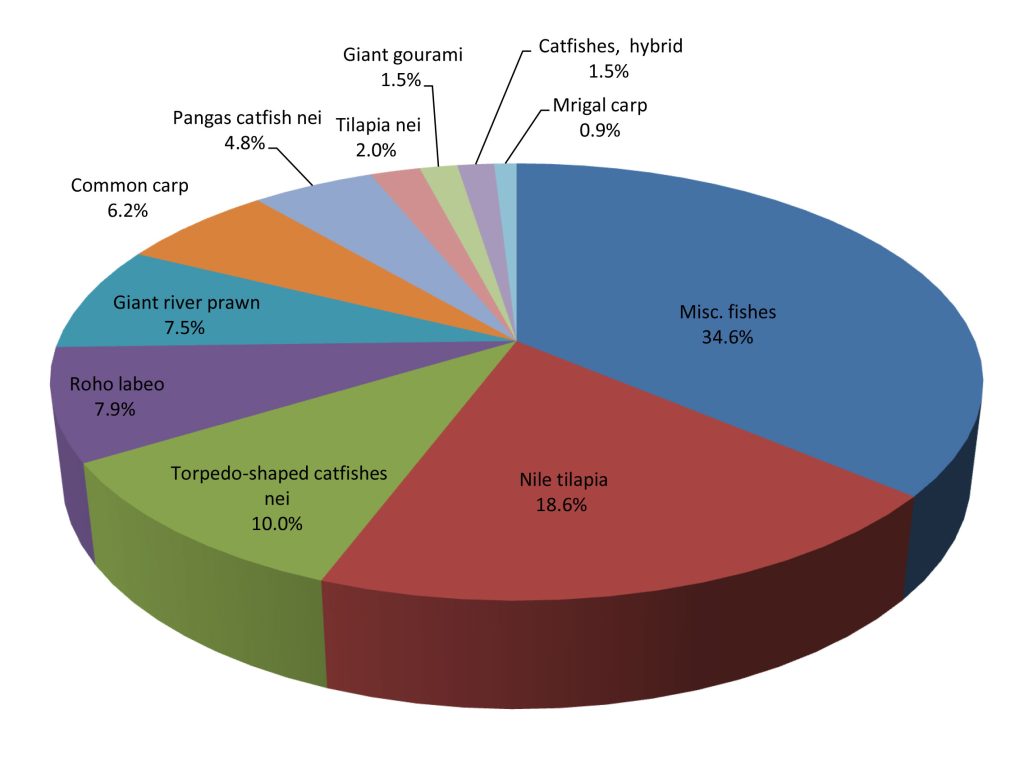
Fig. 8b. Production of major freshwater culture species in 2015 (by value)
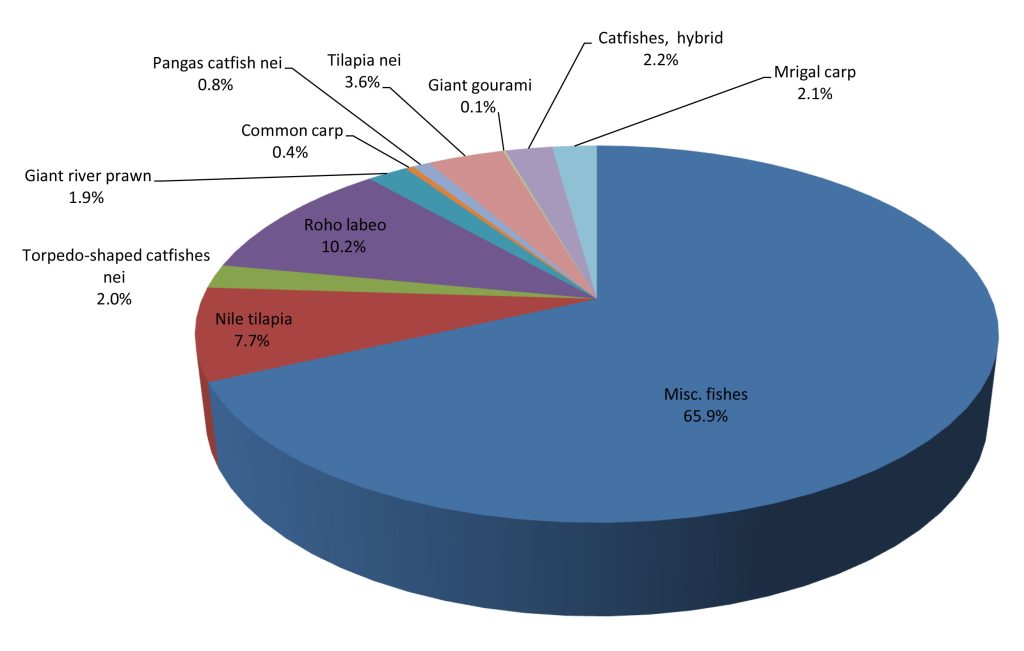
On production value, the highest contributor to the region’s total production value from freshwater culture in 2015 was miscellaneous freshwater fishes which accounted for 65.9% of the region’s total production from freshwater culture, followed by roho labeo (10.2%), Nile tilapia at 7.7%, tilapias nei (3.6%), catfishes hybrid (2.2%), mrigal carp (2.1%), torpedo-shaped catfishes (2.0%), giant river prawn (1.9%), and pangas catfishes nei (0.8%). For the value per quantity of major freshwater culture species, the highest was earned by mrigal carp at US$ 2176/MT followed by Torpedo-shaped catfishes nei at US$ 2122/MT, giant gourami at US$ 1964/MT, tilapia nei at US$ 1678/MT, Nile tilapia at US$ 1492/MT, catfishes hybrid at US$ 1409/MT, and pangas catfishes nei at US$ 1400/MT (Table 11).
Table 11. Production of major freshwater culture species in Southeast Asia (as of 2015)
| Common name | Quantity (MT) |
Percentage freshwater culture production of major commodities to total freshwater culture production (%) |
Value (US$ 1,000) |
Percentage total value of major commodities production from freshwater culture to total freshwater culture value (%) |
Price (US$/MT) |
| Misc. fishes | 2,711,582 | 34.6 | 4,563,327 | 65.9 | 1047 |
| Nile tilapia | 1,459,211 | 18.6 | 559,520 | 7.7 | 1492 |
| Torpedo-shaped catfishes nei |
787,762 | 10.0 | 144,654 | 2.0 | 2122 |
| Roho labeo | 622,543 | 7.9 | 724,115 | 10.2 | 1192 |
| Giant river prawn | 584,738 | 7.5 | 138,515 | 1.9 | 237 |
| Common carp | 482,660 | 6.2 | 27,522 | 0.4 | 1277 |
| Pangas catfish nei | 380,562 | 4.8 | 58,095 | 0.8 | 1400 |
| Tilapia nei | 156,209 | 2.0 | 262,151 | 3.6 | 1678 |
| Giant gourami | 117,215 | 1.5 | 7,487 | 0.1 | 1964 |
| Catfishes, hybrid | 114,181 | 1.5 | 160,853 | 2.2 | 1409 |
| Migral carp | 69,533 | 0.9 | 151,278 | 2.1 | 2176 |
Furthermore, for the value per quantity of production from freshwater culture by country, Singapore presented the highest average value at US$ 5890/MT mainly coming from its production of the marble goby (Oxyeleotris mamoratus). This was followed by Brunei Darussalam at US$ 3500/MT mainly for its production of torpedo-shaped catfishes nei (Clarias spp.), Malaysia at US$ 1866/MT also for its production of torpedo-shaped catfishes nei, Thailand at US$ 1756/MT, Indonesia at US$ 1687/MT, Philippines at US$ 1623/MT, and Myanmar at US$ 1390/MT.
Fishing Gear Analysis
As of 2015, the information on fishing gear used in the region reflected in this publication, was based on the production from marine capture fisheries by type of fishing gear as reported by four countries, namely: Brunei Darussalam, Malaysia, Singapore, and Thailand. From such information, the highest production by type of gears in Brunei Darussalam came from trawls accounting for about 62.1% of the total production of all types of gears. This was followed by purse seine at 28.2% with skipjack tuna (Katsuwonus affinis), yellowfin tuna (Thunnus albacares), rainbow sardine (Dussumieria acuta), kawakawa (Euthynnus affinis), and bigeye scad (Selar crumenophthalmus) comprising almost all of the commodities produced.
For Malaysia, trawls were very prominent with total production that accounted for 44.0% of the country’s production from all types of gears, of which trash fishes comprised 31.5% of the trawl’s total production. This was followed by purse seines contributing about 24.7% to the total production from all types of gears, where scads (Decapterus spp.) comprised 28.9% of the total production from purse seines. Gill net came third contributing 19.9% to the production from all types of gears, where Indian mackerels nei (Rastrelliger spp.) accounted for about 32.8% of the total production from gill net.
For Thailand, trawls gave the highest production by type of gears for about 45.4% with trash fishes representing about 42.3%, marine fishes nei about 11.3%, and common squids nei (Loligo spp.) about 7.1%. Purse seines came in second contributing 37.0% to the production from all types of gears with Stolephorus anchovies (Stolephorus spp.) at about 17.1%, Sardinellas nei (Sardinella spp.) about 13.6%, micellaneous marine fishes about 8.9%, Indian mackerels nei ( Rastrelliger spp.) about 8.6%, and Indian mackerel (Rastrelliger kanagurta) about 8.3%.
In the case of Singapore, trawls gave the highest production by type of gears for about 100.0% with penaeid shrimps nei ( Penaeus spp.) accounting for about 21.7%, snappers nei (Lutjanus spp.) about 5.7%, and narrow-barred Spanish mackerel (Scomberomorus commerson) about 5.4%.
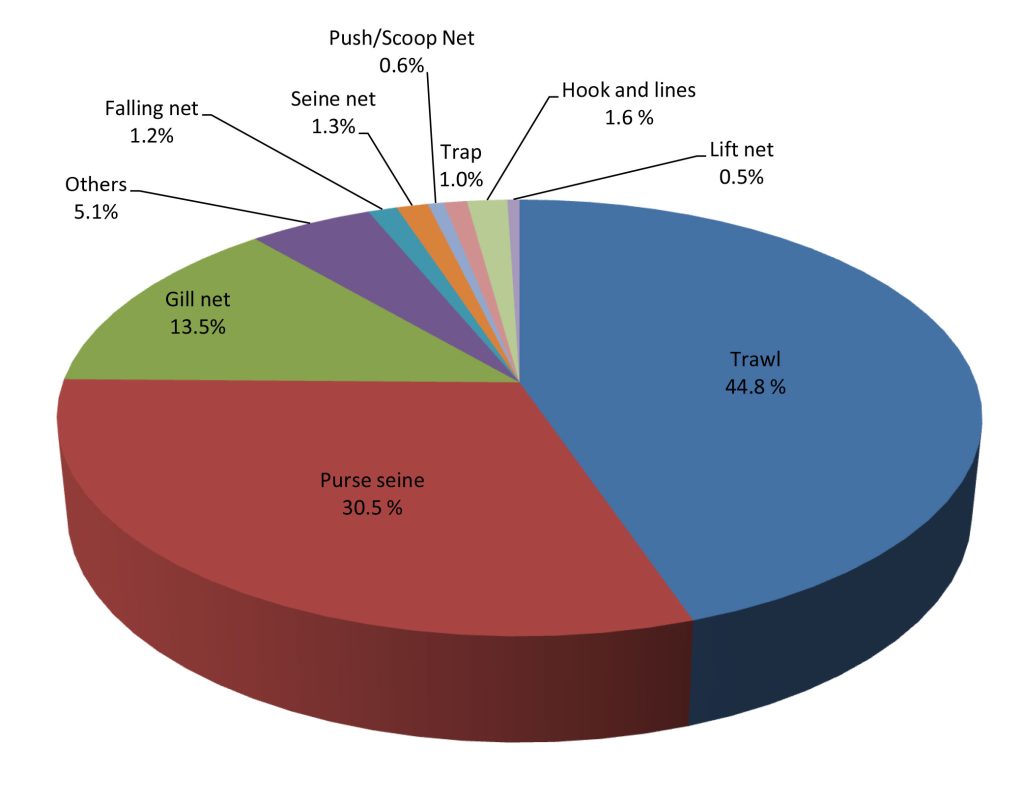
Production from marine capture fisheries of the Southeast Asian region by type of gear is shown in Fig. 9. As the highest producing fishing gear, trawls accounted for about 44.8% of the total production from all types of gears, followed by the purse seines at about 30.5%, gill nets at 13.5%, others at 5.1%, seine nets at 1.3%, falling nets at 1.2%, hook and line also at 1.6%, traps at 1.0%, push/scoop nets at 0.6%, , and lift net at 0.5%. However, the trend on gear used in marine capture fisheries could not be appropriately analyzed as several countries such as Cambodia, Indonesia, Myanmar, Philippines, and Viet Nam did not provide the relevant information.
Fig 9. Marine capture fishery production in 2015 by type of gear used
Number of Fishing Boats by Type
Based on the data available as of 2015, Indonesia had the highest number of boats at 625,708 of which 165,050 were non-powered while 460,658 were powered boats, followed by Cambodia with 98,693 of which 40,606 were non-powered while 58,087 were powered boats. The third highest number was Malaysia with 56,211 of which 3,046 were non-powered and 53,165 powered, followed by Myanmar with 28,455 boats, Viet Nam with 28,719 boats, Thailand with 25,002 boats, Philippines with 6,371 boats, Brunei Darussalam with 36 boats, and Singapore with 30 boats.
Number of Fishers by Working Status
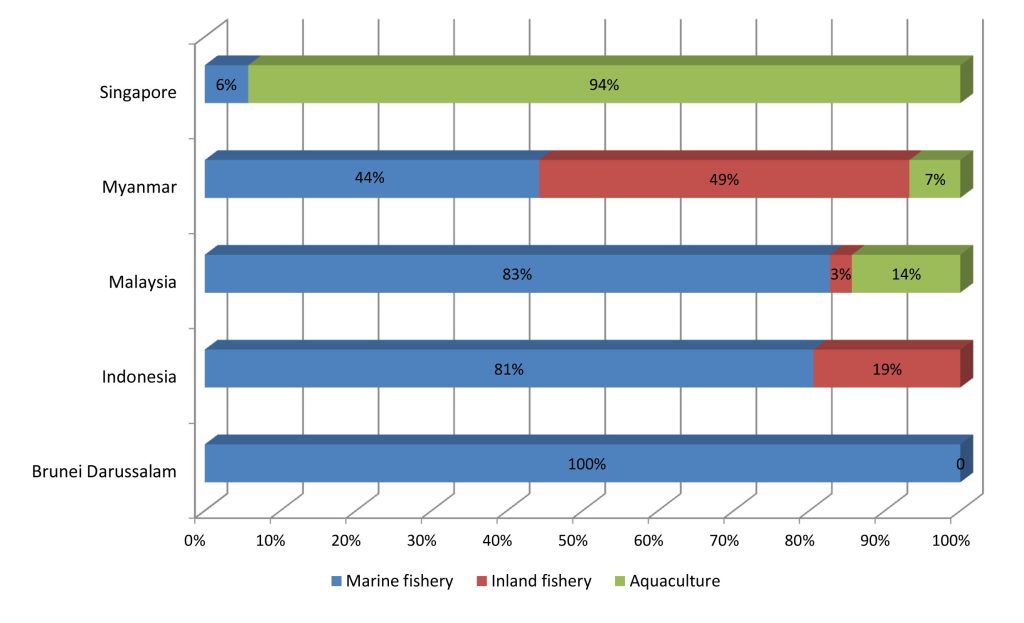
In 2015, Myanmar had the highest number of fishers at 3,216,300 of which 44.2% were involved in marine capture fisheries, 49% in inland capture fisheries, and 6.8% in the aquaculture sector. Indonesia had the second highest number of fishers at 2,724,690 with 80.6% in marine capture fisheries and 19.4% in inland capture fisheries. Malaysia has the third highest number of fishers and fish farmers at 170,399 with 82.7% in marine capture fisheries, 14.3% in the aquaculture sector, and 3.0% in inland sector (Fig 10). Although minimal, Singapore and Brunei Darussalam also reported their respective numbers of fishers but Cambodia, Lao PDR, Philippines, Thailand, and Viet Nam were not able to provide the information on their respective numbers of fishers.
Efforts to improve data availability and statistics in support of data and information should therefore be intensified by encouraging countries to enhance the reporting of number of fishers through the conduct of census and surveys using questionnaires. This would enable the countries to compile the necessary data and information on fisheries including the number of fishers and fish farmers as well as on the number of fishing vessels and gear used.
Fig 10. Number of fishers by working status in 2015
Aquaculture Production of Ornamental Fishes
In 2015, only two countries which reported their respective production from aquaculture of ornamental fishes were Malaysia and Singapore. Of these countries, Malaysia reported the highest production comprising mainly the poecilids, cyprinidae, characins, anabantids, and cichilds. Singapore could not report
its production by species. In terms of value per piece, the highest was posted by the cyprinidaes and poecillids at US$ 0.2/pc and US$ 0.15/pc, respectively in Malaysia. Efforts will be made to improve the compilation of data from aquaculture production of ornamental fishes considering that this is a budding industry in the fisheries sector.
Seed Production for Aquaculture
The need to collect information on the quantity of seeds produced from the aquaculture industry was recommended in many fora as this factor has a significant role to play in enhancing the economic analysis of the region’s aquaculture industry. Thus, compilation of the said information was initiated by SEAFDEC in 2008 although only four countries responded, namely: Cambodia, Malaysia, Myanmar and Singapore, by providing the relevant information. Brunei Darussalam joined in 2009 by also giving its data on this aspect. In 2010, Indonesia entered into the picture but information from Brunei Darussalam and Cambodia had faded away.
In 2011 however, Brunei Darussalam, Indonesia, Malaysia, Myanmar, and Singapore provided their respective relevant information, and continued to provide the relevant information until 2014. Nonetheless, only Brunei Darussalam, Cambodia, Malaysia, and Singapore could provide such information as of 2015. Efforts will be exerted to gather the said information from all the Southeast Asian countries for the next issue of this publication, in order that the true picture of this significant niche of the aquaculture industry
could be established.
Analysis of Producer Price of Commodities From Capture Fisheries
Although the commodities being harvested by the Southeast Asian countries through capture fisheries varied, the trend of the producer prices was established only for certain species which are commonly caught. Results of the analysis however indicated that the producer prices of several commodities harvested by the countries differ in each country, considering that fish prices are influenced by such factors as demand and supply, as well as cost of production including transportation, and alternative commodities.
For inland fish species, the producer price of common carp, Cyprinus carpio in Indonesia in 2015 was recorded at US$ 2.02/kg while it was US$ 1.96/kg in Malaysia, and US$ 1.46/kg in Thailand. For the Hoven’s carp, Leptobarbus hoeveni the producer price in Malaysia was US$ 2.70/kg compared to Indonesia’s US$ 2.26/kg. In the case of the giant river prawn (Macrobrachium rosenbergii), the producer price in Brunei Darussalam was US$ 9.29/kg while the lowest price was US$ 4.92/kg in Indonesia or an average price of US$ 7.10/kg. For other freshwater prawns (Palaemonidae), the producer price in Thailand was US$ 20.44/kg while the lowest price was US$ 2.87/kg in Indonesia or an average price of US$ 11.65/kg.
For marine fish species, the producer price of giant seaperch (=Barramundi), Lates calcarifer in Singapore in 2015 was US$ 7.67/kg compared to Indonesia’s US$ 2.09/kg. Groupers nei, Epinephelus spp. in Singapore cost US$ 8.56/kg in 2015 compared to US$ 5.71/kg in Brunei Darussalam, leopard coral grouper (Plectropomus maculates) in Brunei Darussalam was US$ 10.71/kg compared to US$ 4.3/kg in Indonesia. Likewise, for the threadfin breams nei (Nemipterus spp.) the producer price in Singapore was US$ 6.61/kg which was much higher than that of Indonesia at US$ 1.33/kg.
Meanwhile, the producer price in 2015 of the false trevally (Lactarius lactatius) in Thailand was US$ 10.22/kg compared to Indonesia’s US$ 0.82/kg. For silver pomfret (Pampus argenteus), the producer price in Thailand was US$ 17.52/kg while it was US$ 3.02/kg in Indonesia. For the Indian mackerel (Rastrelliger kanagurta), the producer price in Brunei Darussalam was US$ 3.57/kg while the lowest price was US$ 1.07/kg in Indonesia or an average price of US$ 2.09/kg.
For the giant tiger shrimp (Penaeus monodon), the highest producer price was in the Philippines at US$ 9.54/kg while the lowest was US$ 5.16/kg in Indonesia or an average of US$ 8.0/kg. For banana shrimp (Penaeus merguiensis), the highest price was in Malaysia at US$ 8.40/kg with the lowest in Indonesia at US$ 3.78/kg and an average of US$ 6.65/kg.
For the Indo-Pacific swamp crab (Scylla serrata), the highest price was in Thailand at US$ 5.26/kg with the lowest in Indonesia at US$ 3.21/kg for an average of US$ 4.05/kg. In the case of the blue swimming crab (Portunus pelagicus), the highest price was in Thailand at US$ 8.76/kg and the lowest was in the Indonesia at US$ 2.20/kg, and an average price of US$ 4.39/kg.
As for the common squids nei (Loligo spp.), the highest price was US$ 5.27/kg in Singapore while the lowest was in Indonesia at US$ 1.96/kg with an average of US$ 3.42/kg. As could be gleaned from the abovementioned information, the producer price trends among the countries in the region for the same commodities generally had very wide variations.

