 SEAFDEC Southeast Asian Fisheries Development Center
by Mr. Thana Yenpoeng
2017 Regional Fisheries Policy Network (RFPN) Member for Thailand
INTRODUCTION
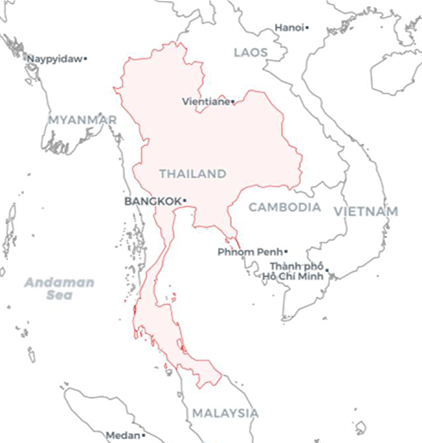
Thailand is located in Southeast Asia bordering the Andaman Sea in the west and the Gulf of Thailand in the east (Figure 1). The country is divided into 76 provinces with about 514,000-km² total land area, total length of 2,624 km continental coastline, 394,000 km² shelf area, and a total water area of 319,750 km2 (FAO, 2018). Thailand has 25 river basins with 254 sub-basins, and the two principal river systems are the Chao Phraya River and the Mekong River. The country’s population in 2015 was 67.96 million and the GDP was US$ 386,674 million, GDP per capita at US$ 5,814.77, and fisheries GDP at US$ 2,947 million.
| Figure 1. Map of Thailand Source: FAOSTAT, 2018 |
 |
Fish is the primary source of animal protein for most of Thailand’s population, particularly those in the coastal provinces. In 2016, fish consumption was 33.73 kg/capita/year, higher than the consumption of the other three main animal protein commodities, namely: pork, beef, and chicken. In Thailand, the price of fish is generally low compared with the other sources of animal protein but the level of consumption varies among its people, because of the differences in household incomes, species preference, and geographic locations.
There are over 650,000 people employed in fish farms and related industries (400,000 in freshwater aquaculture, 78,000 in brackishwater aquaculture, and 184,000 in processing plants). About one-third of those employed in the aquaculture sub-sector are women, particularly in activities related to feed preparation, feeding, harvesting, processing, accounting, and marketing.
STATUS AND TREND OF FISHERIES PRODUCTION
Total Fish Production
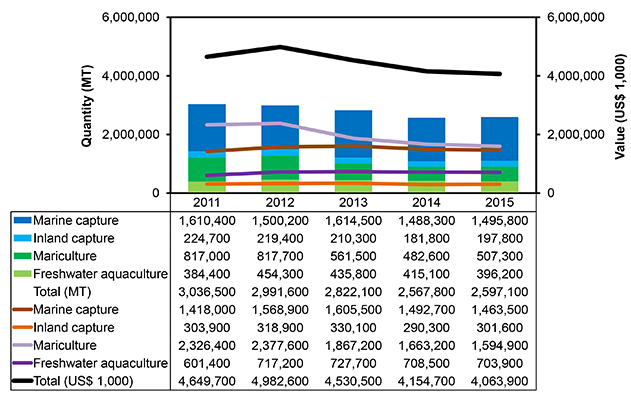
Fisheries production comes from four sub-sectors, namely: marine capture fisheries, inland capture fisheries, coastal aquaculture, and freshwater aquaculture. During the period 2011-2015, fisheries production had decreased starting in 2012 (Figure 2), however, the production slightly increased in 2015 in terms of volume because of the intensified efforts of the government in promoting responsible fishing practices and sustainable management of the fisheries sector, and the country’s adherence to the new paradigm of change in fisheries management.
| Figure 2. Total fisheries production of Thailand in 2011-2015 by quantity (MT) and by value (US$ 1,000) Source: Fisheries Statistics, DOF, Thailand |
 |
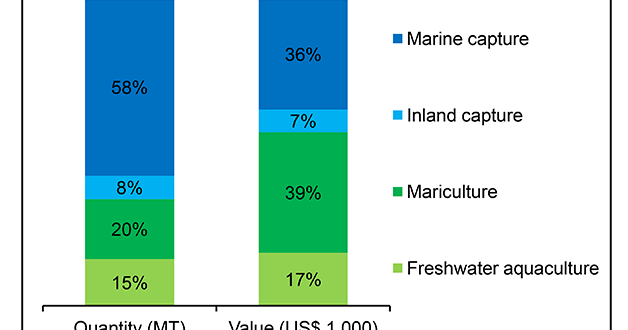
By sub-sector, the largest portion of the production volume in 2015 was derived from marine capture accounting for approximately 58%, followed by coastal aquaculture at about 20%, freshwater aquaculture at about 15%, and inland capture fisheries at 8%. In terms of production value, coastal aquaculture accounted for 39%, marine capture at 36%, freshwater aquaculture at about 17%, and inland capture at 7% (Figure 3).
| Figure 3. Proportion of production from fisheries sub-sectors in Thailand in 2015 by quantity (MT) and value (US$ 1,000) Source: Fisheries Statistics, DOF, Thailand |
 |
Capture Fisheries
- Marine Capture Fisheries
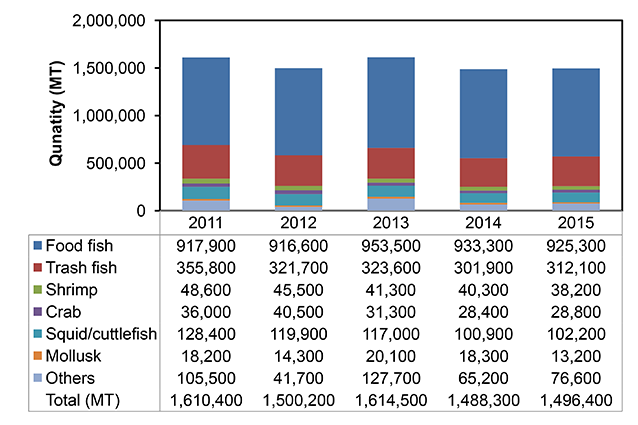
In 2015, production from marine capture fisheries was 1,317,217 MT. The important species caught included the Indo-Pacific mackerel, anchovies, and squid. Figure 4 shows the quantity of major groups of species caught from marine capture fisheries.
| Figure 4. Major groups of species from marine capture fisheries production in Thailand in 2011-2015 by quantity (MT) Source: Fisheries Statistics, DOF, Thailand |
 |
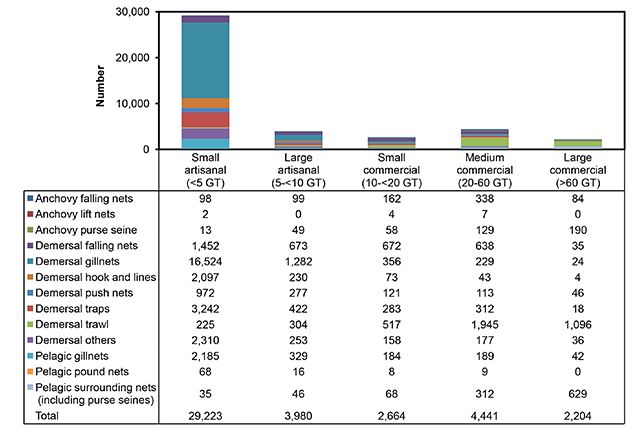
In 2015, a total of 110,616 fishing vessels were surveyed, which were categorized as registered (34.4%), licensed (27.0%), and operating inside (38.4%) and outside (0.2%) Thai waters (Table 1). Smaller vessels use a wide variety of fishing gears including gillnets, falling nets, traps, and hook and lines, while the main fishing gears used by commercial fishing vessels are bottom trawls, purse seines, and falling nets (Figure 5).
| Table 1. Number of surveyed vessels by registration and licensing in Thailand as of 1 August 2015 | ||||
| Category | No. of active fishing vessels operating within Thai waters | No. of vessels registered as fishing vessels | No. of vessels with fishing license | No. of vessels operating outside Thai waters |
| Artisanal | 33,205 | 27,631 | 20,546 | |
| Commercial | 9,307 | 10,382 | 9,307 | |
| Total | 42,512 | 38,013 | 29,853 | 238* |
| * In 2014, 76 fishing vessels obtained fishing licenses. In 2015, some vessels were not active due to license expiration in coastal States and some were applying for license to fish in the high seas. Source: Fisheries Statistics, DOF, Thailand | ||||
| Figure 5. Number of fishing gears and different sizes of fishing vessels in Thailand in 2015 Source: Fisheries Statistics, DOF, Thailand |
 |
- Inland Capture Fisheries
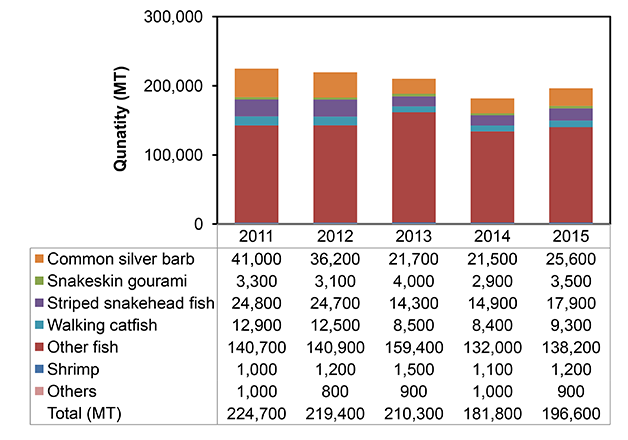
Production from inland capture was 196,600 MT in 2015 although the overall production trend was decreasing in 2011-2015. The important species were Nile tilapia, walking catfish, common silver barb, and giant freshwater prawn (Figure 6).
| Figure 6. Major groups of species from inland capture fisheries production in Thailand in 2011-2015 by quantity (MT) Source: Fisheries Statistics, DOF, Thailand |
 |
Aquaculture
- Mariculture
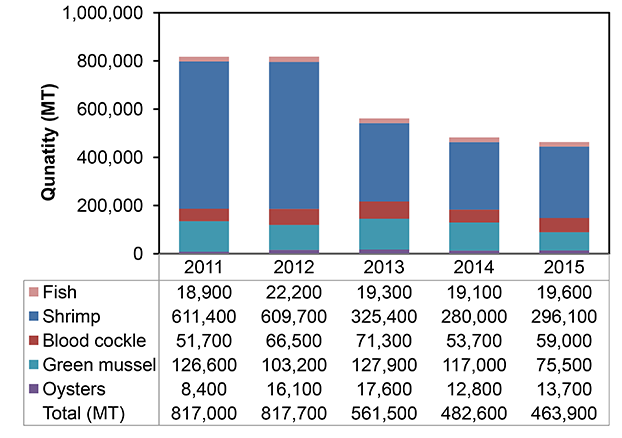
Mariculture is practiced in the interface between freshwater and seawater. This sub-sector is becoming very important as it serves as alternative means of producing food fish that could substitute for the insufficiency of fish caused by the depletion of wild marine fish stocks. The rapid growth of mariculture is mainly due to the increasingly rapid development in culture technology. In addition, most of the marine shrimp, shellfish, and marine finfish cultured have relatively high prices and large market. Marine shrimp is the predominant species and makes a major contribution to export earnings. In 2015, marine shrimp production was 296,100 MT followed by shellfishes and fish (Figure 7).
| Figure 7. Major groups of species from mariculture production in Thailand in 2011-2015 by quantity (MT) Source: Fisheries Statistics, DOF, Thailand |
 |
- Freshwater aquaculture
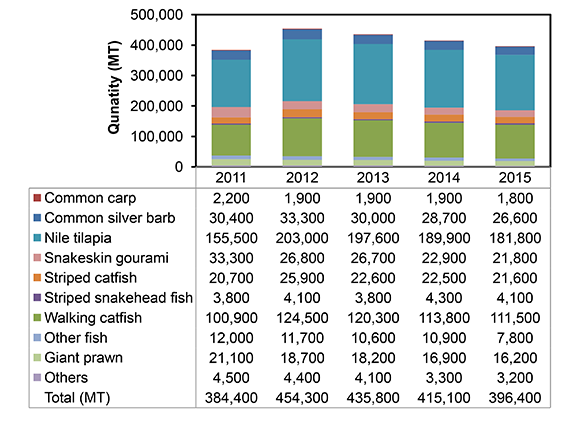
Freshwater aquaculture is carried out either as monoculture or polyculture, depending on the species cultured. Monoculture is not only common for raising carnivorous species such as the hybrid catfish and snakehead, but also for freshwater prawn, striped catfish, and sand goby. Polyculture is employed principally to raise herbivorous and filter-feeding species, such as tilapia, silver barb, common carp, Chinese carps, and mrigala. Figure 8 shows the country’s production of major groups of freshwater aquaculture species in 2011-2015.
| Figure 8. Major groups of species from freshwater aquaculture production in Thailand in 2011-2015 by quantity (MT) Source: Fisheries Statistics, DOF, Thailand |
 |
- Ornamental fish culture
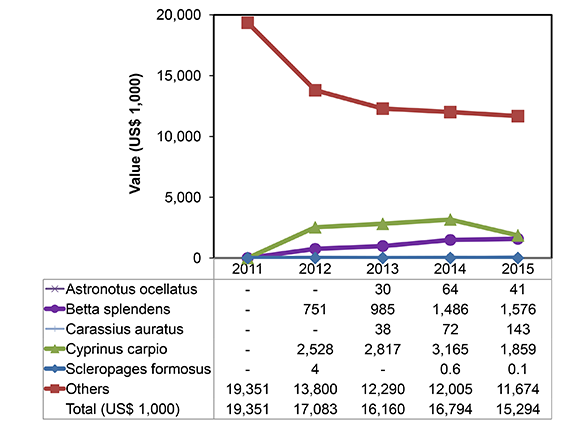
The ornamental fish trade is divided into two categories: freshwater ornamental fish (90%) and marine ornamental fish (10%). At present, there are about 350,000 owners operating the ornamental fish trade in Thailand. There are about 500 shops, of which 50% are in Bangkok and in other provinces in Ratchaburi, Chiang Mai, Phuket, Nakhon Ratchasima, Khon Kaen, and Udon Thani. The value of exported ornamental fish species in 2011-2015 is shown Figure 9.
| Figure 9. Value of ornamental fish species exported by Thailand in 2011-2015 by (US$ 1,000) Source: Fisheries Statistics, DOF, Thailand |
 |
FISH UTILIZATION
From 2011 to 2015, about 81% of the total fish production was used for human consumption while 19% was used for animal feed. For marine fish, about 22% was trash fish (used for non-food purposes most of which was channeled to the fishmeal industry) and 78% was utilized for human consumption. Around 24% of marine fish was consumed fresh and the remaining was processed into chilled, frozen, canned, or steamed, smoked, dried and/or salted, and/or converted into shrimp paste or fish sauce. All freshwater fish was used as food and as much as 76% was consumed fresh.
FISH TRADE
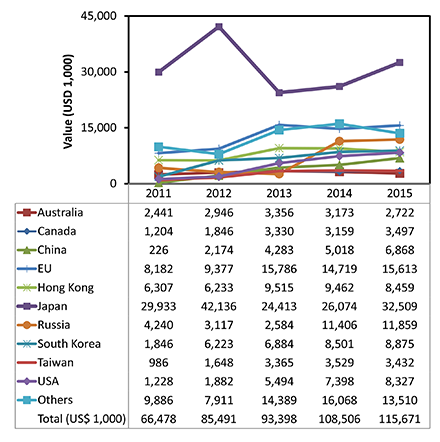
In 2015, the total value of surimi products exported to different countries was US$ 115,671 million as shown in Figure 10. In the same year, the country’s export of fishery products was valued at US$ 5,947 million (Table 2) while the value of imported fisheries products was US$ 2,578.6 million (Table 3). Thailand imports fishery products mostly for use as raw materials for processing of fishery products meant for the export market.
| Figure 10. Destination countries of surimi products exported by Thailand in 2011-2015 by value (US$ 1,000) Source: Fisheries Statistics, DOF, Thailand |
 |
| Table 2. Destination countries/regions of fishery products exported by Thailand in 2011-2115 by value (US$ 1,000) | |||||
| Destination country/region | 2011 | 2012 | 2013 | 2014 | 2015 |
| Africa | 361,100 | 603,800 | 487,900 | 480,000 | 429,500 |
| ASEAN | 386,200 | 406,300 | 404,900 | 469,500 | 456,500 |
| Australia | 334,000 | 394,600 | 354,200 | 366,900 | 315,200 |
| Bangladesh | 900 | 1,500 | 1,900 | 2,200 | 8,800 |
| Canada | 339,100 | 352,000 | 272,300 | 275,900 | 239,000 |
| China | 136,700 | 154,500 | 183,000 | 235,500 | 229,800 |
| Costa Rica | 2,000 | 4,300 | 2,700 | 5,700 | 6,600 |
| Dominican republic | 14,500 | 14,600 | 9,800 | 9,900 | 11,900 |
| EFTA | 49,600 | 48,100 | 41,800 | 41,100 | 42,700 |
| EU | 1,073,900 | 1,001,200 | 924,300 | 791,100 | 594,000 |
| Guatemala | 2,100 | 4,100 | 3,000 | 3,500 | 4,100 |
| Honduras | 2,900 | 3,000 | 2,700 | 2,500 | 3,100 |
| Hong Kong | 94,300 | 100,600 | 96,200 | 105,600 | 104,300 |
| India | 8,800 | 11,600 | 11,400 | 6,000 | 10,900 |
| Jamaica | 11,100 | 14,700 | 12,500 | 12,800 | 11,900 |
| Japan | 1,610,200 | 1,698,900 | 1,356,600 | 1,255,200 | 1,182,400 |
| South Korea | 120,800 | 126,300 | 102,100 | 162,500 | 162,800 |
| Macedonia | 2,500 | 2,900 | 2,400 | 2,900 | 2,800 |
| Maldives | 4,000 | 2,300 | 2,800 | 3,500 | 2,400 |
| Mexico | 2,000 | 1,200 | 1,800 | 1,700 | 2,300 |
| Middle East | 298,800 | 378,900 | 350,100 | 385,600 | 379,900 |
| New Zealand | 39,500 | 47,200 | 38,300 | 40,900 | 35,700 |
| Nicaragua | 2,500 | 3,900 | 3,600 | 4,500 | 6,700 |
| Panama | 6,200 | 9,700 | 8,900 | 10,200 | 12,400 |
| Papua new guinea | 7,100 | 13,900 | 11,800 | 16,000 | 15,000 |
| Puerto Rico | 6,900 | 2,300 | 1,800 | 2,700 | 2,500 |
| Russia | 44,500 | 50,500 | 51,300 | 65,500 | 41,400 |
| Serbia | 4,400 | 2,500 | 2,600 | 4,500 | 4,700 |
| South America | 85,400 | 107,600 | 110,100 | 119,800 | 129,800 |
| Sri Lanka | 46,300 | 35,800 | 48,400 | 41,300 | 56,300 |
| Taiwan | 84,200 | 81,800 | 83,700 | 77,600 | 80,800 |
| Trinidad | 4,500 | 4,300 | 4,000 | 5,000 | 4,100 |
| Tunisia | 51,900 | 38,000 | 27,600 | 28,500 | 13,000 |
| USA | 2,135,200 | 1,781,600 | 1,443,300 | 1,439,800 | 1,287,100 |
| Others | 50,600 | 51,000 | 46,600 | 46,300 | 56,700 |
| Total | 7,424,700 | 7,555,500 | 6,506,400 | 6,522,200 | 5,947,100 |
| Source: Fisheries Statistics, DOF, Thailand | |||||
| Table 3. Destination countries/regions of fishery products รทported by Thailand in 2011-2115 by value (US$ 1,000) | |||||
| Country/region of origin | 2011 | 2012 | 2013 | 2014 | 2015 |
| Africa | 31,200 | 41,600 | 38,100 | 16,500 | 50,600 |
| ASEAN | 404,000 | 522,200 | 482,400 | 494,100 | 470,700 |
| Australia | 11,000 | 7,700 | 9,400 | 10,700 | 9,900 |
| Bangladesh | 2,200 | 1,900 | 3,200 | 3,000 | 3,100 |
| Belize | 500 | – | 1,400 | 1,900 | 2,300 |
| Canada | 17,000 | 29,700 | 17,200 | 20,300 | 22,400 |
| China | 192,300 | 251,500 | 267,200 | 359,400 | 388,300 |
| Cook Islands | 400 | 600 | 1,400 | 1,900 | 1,800 |
| EFTA | 98,700 | 104,700 | 113,200 | 114,600 | 116,800 |
| EU | 91,800 | 62,400 | 60,600 | 75,500 | 50,500 |
| Faeroe Islands | 600 | 500 | 600 | 500 | 1,300 |
| Fiji | 14,000 | 8,800 | 7,200 | 7,500 | 5,100 |
| Greenland | 5,300 | 6,100 | 2,200 | 2,900 | 5,100 |
| India | 98,400 | 98,100 | 116,100 | 96,700 | 133,300 |
| Japan | 151,800 | 185,500 | 194,500 | 177,800 | 169,700 |
| Kiribati | 22,100 | 31,900 | 49,700 | 37,600 | 83,300 |
| South Korea | 158,000 | 194,900 | 188,200 | 96,800 | 120,800 |
| Maldives | 35,200 | 31,700 | 62,500 | 36,700 | 39,200 |
| Marshall Islands | 79,700 | 74,600 | 65,600 | 36,400 | 21,900 |
| Mauritius | 2,300 | 3,000 | 3,600 | 1,600 | 2,100 |
| Mexico | 16,300 | 28,200 | 9,800 | 7,000 | 4,300 |
| Micronesia | 25,400 | 40,200 | 15,300 | 12,800 | 11,700 |
| Middle East | 18,900 | 22,000 | 8,200 | 21,300 | 28,700 |
| New Zealand | 13,100 | 20,000 | 31,300 | 37,500 | 24,100 |
| Pakistan | 29,300 | 25,500 | 31,800 | 45,100 | 50,400 |
| Papua new guinea | 47,600 | 66,200 | 47,900 | 68,100 | 99,800 |
| Russia | 45,900 | 43,800 | 30,800 | 35,700 | 33,300 |
| Seychelles | 4,400 | 5,500 | 3,700 | 9,600 | 3,000 |
| Solomon Islands | 22,800 | 19,300 | 18,000 | 9,200 | 11,300 |
| South America | 142,800 | 164,300 | 186,500 | 216,300 | 162,000 |
| Taiwan | 249,700 | 337,100 | 279,200 | 229,200 | 194,700 |
| Tuvalu | 6,500 | 6,400 | 16,000 | 1,700 | 3,200 |
| USA | 248,500 | 242,800 | 294,600 | 255,900 | 208,700 |
| Vanuatu | 111,000 | 144,400 | 163,700 | 63,900 | 14,200 |
| Others | 29,100 | 35,300 | 23,800 | 41,900 | 31,100 |
| Total | 2,427,800 | 2,858,400 | 2,844,900 | 2,647,600 | 2,578,700 |
| Source: Fisheries Statistics, DOF, Thailand | |||||
FISHERIES POLICIES AND LEGAL FRAMEWORKS
National Laws
The new fisheries law in Thailand recognizes the importance of the fishing industry to the national economy and its role as an important employer and source of livelihood in coastal communities. New regulations require the Thailand National Fisheries Committee and provincial fishing industry groups to set up rules and manage the fisheries within their areas of authority. Membership of the national and local committees is specified under the law and includes government agencies, the private sector, and various fisheries committees and associations. The policy is very clear that instead of aiming for increased production, it is more important to promote the sustainable production of existing resources. The DOF will manage the fisheries to ensure maximum sustainable yield. Fishing licenses will be issued according to the available resources, and free fishing access would no longer be continued. Big efforts to reduce bycatch are promoted under the new ordinance by enlarging the mesh size to 5 cm for trawlers. Also, many fishing gears are banned such as push nets, except for small crustaceans, and stake traps. The new ordinance has a clear direction to promote environment-friendly production practices and to protect the environment as well.
International Compliance
Efforts to eliminate IUU fishing and ensure the sustainability of Thailand’s fisheries have been strengthened with the enactment of the new Royal Ordinance on Fisheries B.E. 2558 (2015) which was approved by the Cabinet and received royal assent on 14 November 2015. Consisting of 176 sections, the new law is designed to achieve its objectives through five mechanisms: a licensing system, a vessel monitoring system, vessel inspection, a traceability system, and effective law enforcement. The new law is being implemented through 28 port in-port out centers at Thailand’s main fishing ports by officers from the Department of Fisheries (DOF), Ministry of Labor, Marine Department and its mobile team units, and the Ministry of Foreign Affairs (MFA).The responsibilities of DOF have been increased under the new ordinance which also entail increased manpower requirements. DOF officers are now inspecting all fishing boats before departure on fishing trips to prevent illegal fishing and slavery. DOF also inspects the vessel registration before departure as well as the fishing gear, crew, and their nationalities.
Gender Policies
Women have also assumed a leading role in the rapid growth of aquaculture, with their participation along the aquaculture value chain (production, transforming, and marketing) much more than in capture fisheries. The SSF Guidelines have opened up new policy space on gender equality. Yet, in implementing the Guidelines, women have been deterred from taking part in decision making, are invisible in most fisheries statistics and their interests excluded from national policies unless NGOs and women’s groups continue exerting efforts to advocate for their inclusion. Even when women’s needs are recognized, money and expertise may not have been allocated. In a hopeful sign, some recent projects are committed to promote gender equality and equity in the country’s fisheries sector.
REFERENCES
DOF. 2017. Fisheries statistics of Thailand 2015. Fisheries Development Policy and Strategy Division, Department of Fisheries, Ministry of Agriculture and Cooperatives, Thailand. 92 pp
FAO. 2018. Fishery and Aquaculture Country Profiles – The Kingdom of Thailand. Available at http://www.fao.org/fishery/facp/THA/en. Accessed on 28 May 2018.
FAOSTAT. 2018. Statistics Division, Food and Agriculture Organization of the United Nations. Available at http://www.fao.org/faostat/en/#country/216. Accessed on 28 May 2018.