 SEAFDEC Southeast Asian Fisheries Development Center
by Mr. Ifan Ariansyach
2017 Regional Fisheries Policy Network (RFPN) Member for Indonesia
INTRODUCTION
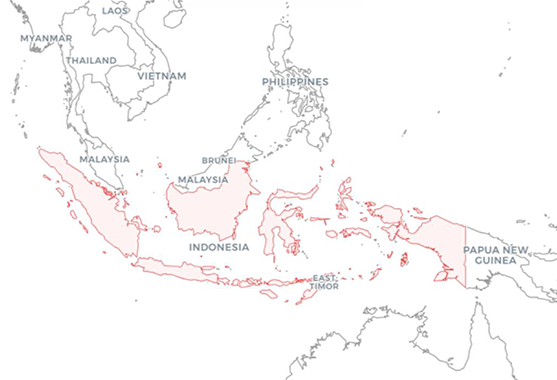
Indonesia is the largest archipelagic country in the world consisting of 17,504 islands and with coastlines that measure a total of 99,093 km. The country lies strategically between two oceans, the Pacific Ocean and the Indian Ocean (Figure 1). With a unique geographical character, Indonesia encompasses 1,922,570 km2 of land mass and 3,257,483 km2 of water areas that include inland seas, bays, shelf, and other bodies of water as well as an exclusive economic zone with an area of around 2.7 million km2 (BIG, 2017a; BIG, 2017b). Indonesia is the world’s fourth most populous country with a total population of 255 million in 2015.
| Figure 1. Map of Indonesia Source: FAOSTAT, 2018 |
 |
The fisheries sector in Indonesia plays an important role in supporting national food security, since most of the communities are in the coastal areas and fish is one of the main components in the peoples’ diet. In 2015, the country’s average fish consumption was 41.11 kg/capita/year (KKP, 2016a). During the third quarter of 2015, the fisheries sector contributed 2.46% to national GDP (KKP, 2015a), which was mainly generated by 964,231 capture fisheries households and 1,649,080 aquaculture households (BPS, 2016).
STATUS AND TREND OF FISHERIES PRODUCTION
Total Fish Production
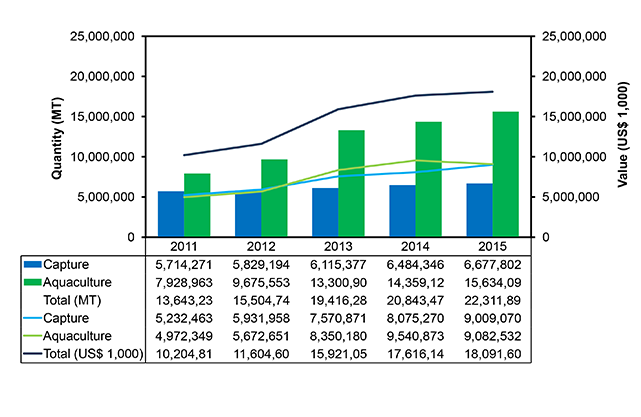
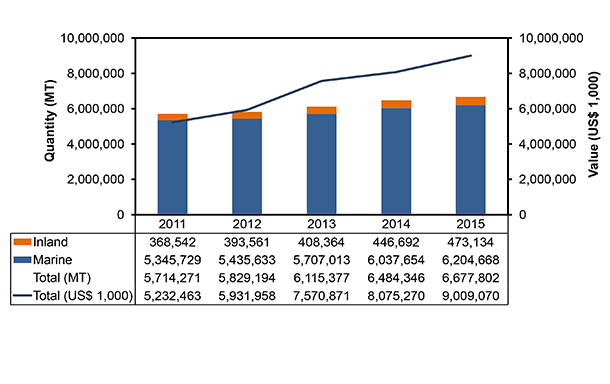
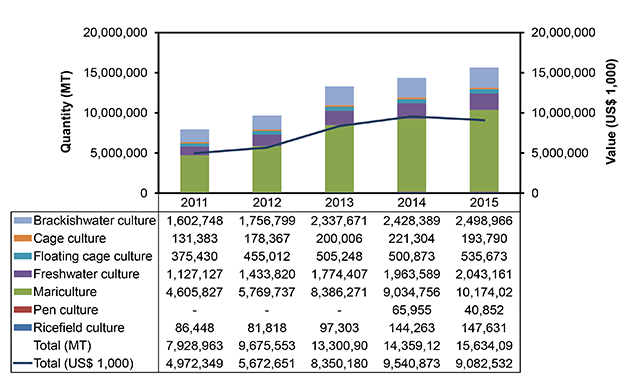
Fisheries production of Indonesia that comes from capture fisheries and aquaculture had increased gradually during 2011-2015. In 2015, the total production has reached about 22.31 million metric tons (MT), valued at around US$ 18.10 billion in 2015 (Figure 2). For capture fisheries (inland and marine), the production trend was steady in 2011-2015 (Figure 3) while there was a steep increase in the production from aquaculture during the same period (Figure 4).
| Figure 2. Total fisheries production of Indonesia in 2011-2015 by quantity (MT) and value (US$ 1,000) Source: KKP, 2016b |
 |
| Figure 3. Capture fisheries production of Indonesia in 2011-2015 by quantity (MT) and value (US$ 1,000) Source: KKP, 2016b |
 |
| Figure 4. Aquaculture production of Indonesia in 2011-2015 by quantity (MT) and value (US$ 1,000) Source: KKP, 2016b |
 |
CAPTURE FISHERIES
Marine Capture Fisheries
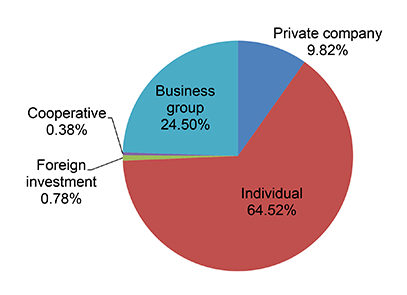
In Indonesia, the fishing licenses in marine capture fisheries are owned by individual fishermen (64.5%), business groups (24.5%), private companies (9.8%), foreign investors (0.8%), and cooperatives (0.4%) as shown in Figure 5. It is important to note that this information is only for the licenses issued by the central government for fishing vessels greater than 30 GT.
| Figure 5. Ratio of ownership of fishing licenses in marine capture fisheries in Indonesia Source: KKP, 2015b |
 |
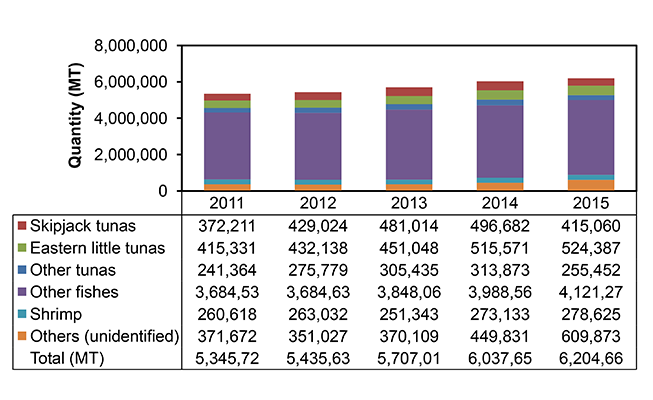
The country’s production from marine capture fisheries showed a steady growth between 2011 and 2015. In 2015, the total production was 6.2 million MT, dominated by tunas and and other tuna species (Figure 6).
| Figure 6. Major species from marine capture fisheries production in Indonesia in 2011-2015 by quantity (MT) Source: KKP, 2016b |
 |
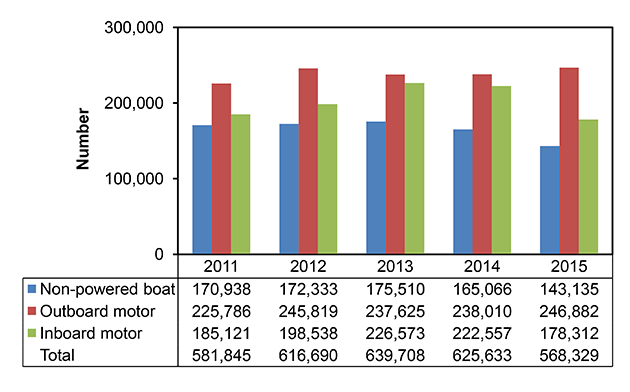
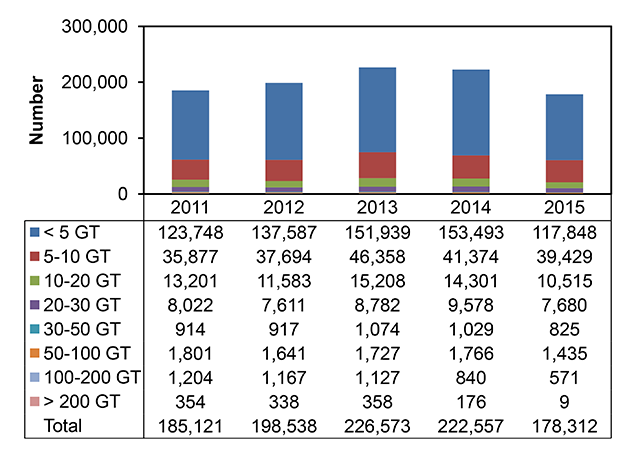
In Indonesia, the number of fishing boats (by type and by size) had increased from 581,845 in 2011, rising steeply to about 625,633 boats in 2014 (Figures 7 and 8). This trend was influenced by the program of the government that provides boats to fishermen as well as the continued renewal of fishing permits. In 2015 however, the number had decreased as an effect of the moratorium on issuance of new fishing licenses which was made effective in late 2014.
| Figure 7. Number of fishing boats in marine capture fisheries in Indonesia in 2011-2015 by type Source: KKP, 2016b |
 |
| Figure 8. Number of fishing boats in marine capture fisheries in Indonesia in 2011-2015 by size Source: KKP, 2016b |
 |
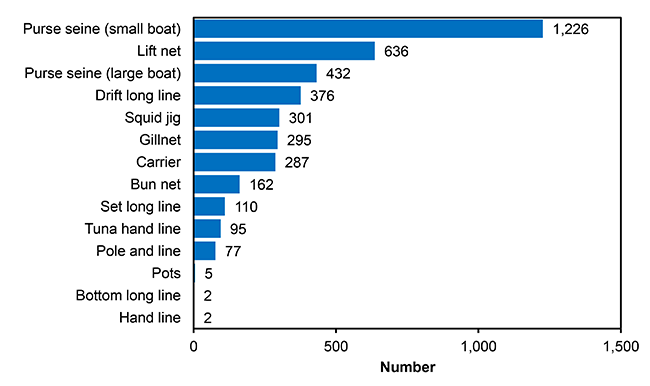
There are many types of fishing gears in Indonesia which vary according to the target fish and season as well as the characteristics of the fishing areas (Figure 9). It should be noted however that there had been some difficulties in drawing information related to fishing gears used in the waters of Indonesian since fishing boats of less than 30 GT and the gears used are under the authority of the provincial government.
| Figure 9. Type and number of fishing gears in marine capture fisheries in Indonesia in 2016 Source: KKP, 2016b |
 |
Inland Capture Fisheries
Indonesia also encompasses vast area of inland waters that measure a total of around 13.85 million ha. These areas consist of river ecosystems and flood plains (12.0 million ha), lakes (1.8 million ha), and man-made lakes or reservoirs (0.05 million ha) that spread across the archipelagic islands such as Kalimantan, Sumatera, Papua, Celebes and Java, Bali and Nusa Tenggara Island (Sukadi and Kartamihardja, 1995). People in Sumatera, Kalimantan, and other islands generally consume inland fishery products, majority of which are catfishes (Pangasius hypopthalmus), milkfish (Chanos chanos), carps, some freshwater prawns as well as endemic fishes such as Mystacoleucus padangensis, Mystus planices, Chitala lopis, Barbodes schwanenfeldi, and the Oxyeleotris heterodon found in Papua Island. However, the areas that have potentials for inland capture fisheries in Indonesia have not been optimally utilized despite its huge benefit. This could be because inland capture fisheries is not as popular as marine capture fisheries, and are mostly done as side activities. Thus, information on production from inland capture fisheries is limited.
AQUACULTURE
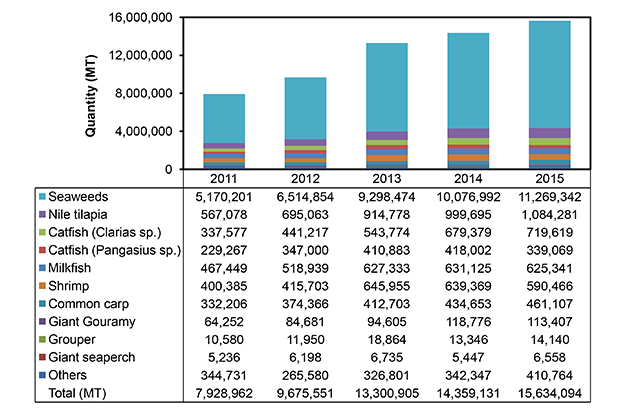
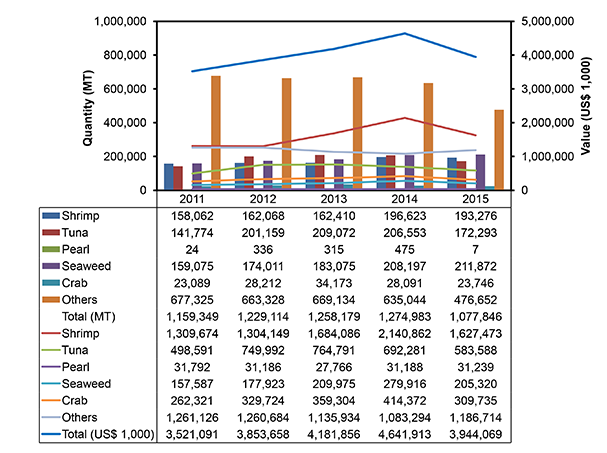
As an archipelagic country, Indonesia has a widespread area suitable for aquaculture development. Based on 2015 data, about 282,075 ha is available for mariculture, 667,083 ha for brackishwater culture, and 305,216 ha for freshwater aquaculture (KKP, 2016b). However, only less than 10% of these areas have been utilized for aquaculture production. Since the late 1970s, the aquaculture production of Indonesia which makes use of either traditional, semi-intensive or intensive methods, had significantly increased. The most common culture systems are: mariculture, seaweed culture, floating net culture, brackishwater culture, freshwater culture, cage culture, floating cage culture, pen culture, and ricefield fish culture. The country’s production from aquaculture indicated a steady growth between 2011 and 2015 that mainly came from mariculture. In 2015, its total production from aquaculture was about 15 million MT dominated by seaweeds (Figure 10).
| Figure 10. Important species from aquaculture production in Indonesia 2011-2015 by quantity (MT) Source: KKP, 2016b |
 |
ORNAMENTAL FISH CULTURE
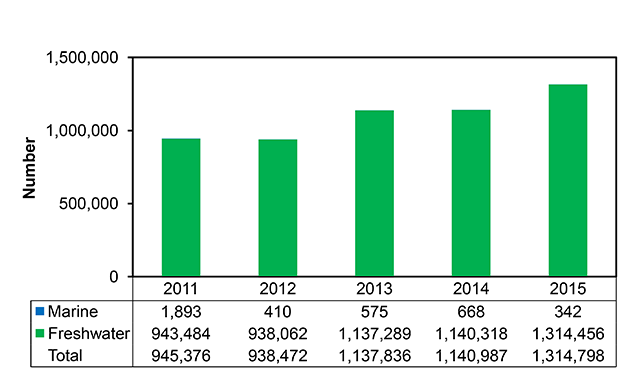
Production of ornamental fishes in Indonesia grew steadily during 2011-2015 dominated by freshwater ornamental fishes (Figure 11), such as koi, comet, betta, koki, arowana, and many others. The low production of marine ornamental fish species is due to strict provisions and prohibition of the collection and culture of some marine ornamental fishes. The marine ornamental fish species that are commonly produced include clownfish, seahorse, mandarinfish, Banggai cardinalfish, blue devil, among others.
| Figure 11. Ornamental fish production of Indonesia in 2011-2015 by number Source: KKP, 2016b |
 |
FISH UTILIZATION
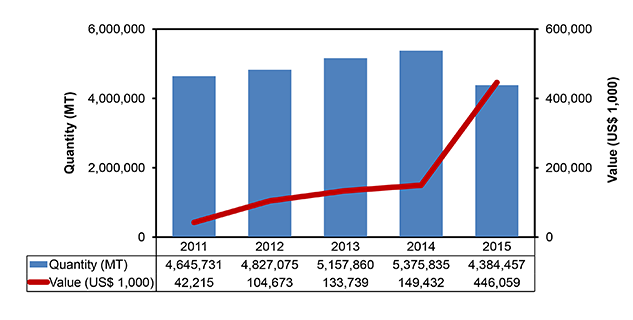
Eighty-five percent of the fisheries production of Indonesia goes to local market, while the rest are exported mainly to Asian markets. Fishery products coming from small-scale fisheries are mostly distributed to local markets either for direct consumption or for processing (e.g. smoked, salted). Some fishery products are supplied to hotels, restaurants, catering services, and retail sellers. Fishery products coming from medium to large-scale fisheries are generally processed for canned products (e.g. sardines) or used as raw materials for processing into export products, boiled fish products, fish bait, and fortification products (KKP, 2016b). The quantity and value of processed fishery products of Indonesia are shown in Figure 12.
| Figure 12. Production of processed fishery products of Indonesia in 2011-2015 by quantity (MT) and value (US$ 1,000) Source: KKP, 2016b |
 |
FISH TRADE
The country’s quantity and value of exported fishery products showed an increasing trend during 2011-2014 but with a slight fall in 2015 (Figure 13). The continuity of the supply of raw materials is the main issue faced by fish processing industries in Indonesia exacerbated by the lack of good quality infrastructure across the country such as cold storage, filleting technology, among others. In addressing this issue, the government established the National Fish Logistic System in line with the development of fish processing industries across the country to be able to increase production as well as control and stabilize the stock and price.
| Figure 13. Major fishery products exported by Indonesia in 2011-2015 by quantity (MT) and value (US$ 1,000) Source: KKP, 2016b |
 |
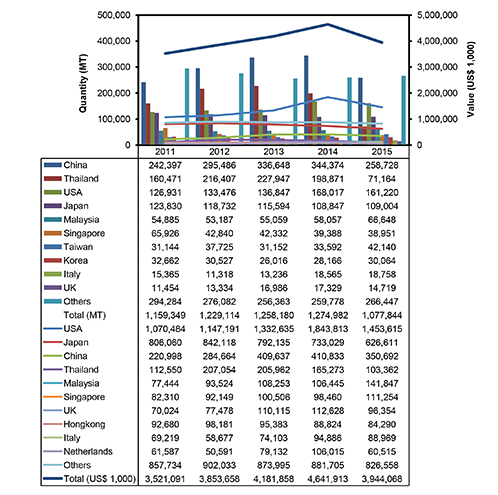
The country’s export volume and value of fishery products were increasing in 2011-2014 but decreased in 2015. The Asia continent is the dominant market for Indonesian fishery products and the major countries of destination include China, Thailand, Japan, Malaysia, Singapore, Taiwan, and Korea (Figure 14).
| Figure 14. Major destination countries of fishery products exported by Indonesia in 2011-2015 by quantity (MT) and value (US$ 1,000) Source: KKP, 2016b |
 |
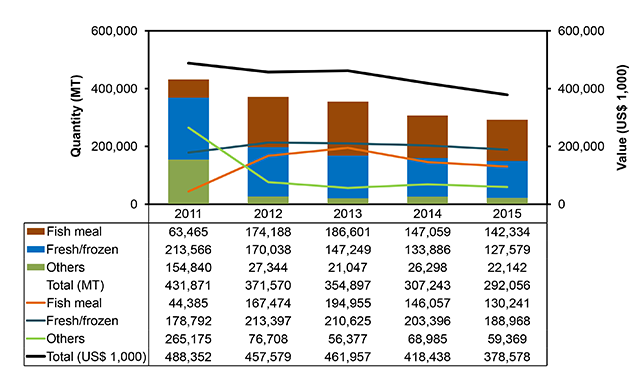
In general, the country’s import quantity and value of fish product by major commodities between 2011 and 2015 decreased steadily (Figure 15). On the contrary, the trend of fishmeal importation had increased significantly from 63,465 MT in 2011 to 186,601 MT in 2013, but decreased gradually afterward.
| Figure 15. Major fish commodities imported by Indonesia in 2011-2015 by quantity (MT) and value (US$ 1,000) Source: KKP, 2016b |
 |
FISHERIES POLICIES AND LEGAL FRAMEWORKS
Like in other countries of the Southeast Asian region, the fisheries sector in Indonesia is also facing several problems such as illegal, unregulated and unreported (IUU) fishing in many areas in its waters exacerbated by transnational organized crimes. Fishery products are challenged in maintaining the quality as some importing countries had rejected some of the country’s fishery products. Unbalanced development of the country’s overall fisheries sector is prevailing because of the vast archipelagic characteristic of the country. The capacity of human resources and technological interventions related to fisheries should be improved to be able to cope with the current standards and demand in fisheries development.
Nonetheless, in order to develop a sustainable fisheries, the government of Indonesia has implemented several efforts such as improved data collection and reporting, moratorium on foreign fishing vessel operations in the country’s waters, prohibition of transshipments at sea, prohibition of catching spawners of lobster and crab, prohibition of trawls and purse seine operations, and enforcement of closed areas for conservation.
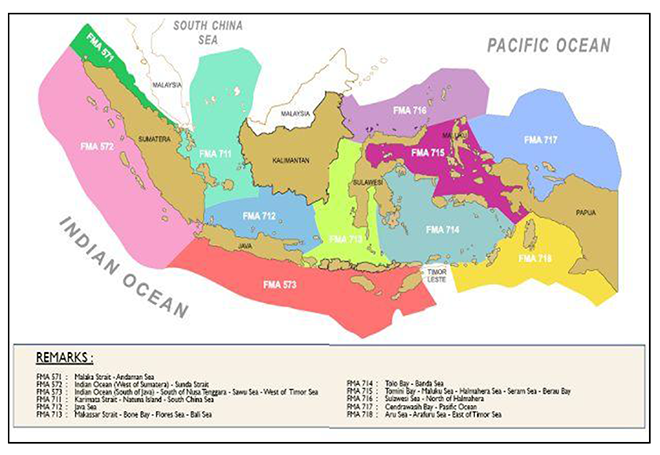
The marine waters of Indonesian had been divided into 11 Fisheries Management Areas (Figure 16) based on the characteristics of the fish resources and its environment (MMAF, 2009). These are:
- WPP-RI 571 Malacca Strait and Andaman Sea
- WPP-RI 572 Indian Ocean of Western Sumatera and Sunda Strait
- WPP-RI 573 Indian Ocean of Southern Java, Southern Nusa Tenggara,Sawu Sea, and Western of Timor Sea
- WPP-RI 711 Karimata Strait, Natuna Sea and South China Sea
- WPP-RI 712 Java Sea
- WPP-RI 713 Makassar Sea, Bone Bay, Flores Sea and Bali Sea
- WPP-RI 714 Tolo Bay and Banda Sea
- WPP-RI 715 Tomini Bay, Maluku Sea, Halmahera Sea, Seram Sea and Berau Bay
- WPP-RI 716 Sulawesi Sea and Northern sea of Halmahera Island
- WPP-RI 717 Cendrawasih Bay and Pacific Ocean
- WPP-RI 718 Aru Bay, Arafuru Sea, and Eastern Timor Sea
| Figure 16. Fisheries management areas in Indonesia (Source: FAO, 2018) |
 |
NATIONAL LAWS
- Law Number 31 Year 2004 as amended by Law Number 45 Year 2009 regarding fisheries. Derivative regulations have also been developed under this law, such as fishing license and vessel registration, management of IUU and destructive fishing, standardization of fish processing, tax, conservation as well as estimation of the potency of fishery resources in the Fisheries Management Areas
- Law Number 27 Year 2007 as amended by Law Number 1 Year 2014 regarding management of coastal areas and small islands. Derivative regulations are also now being developed under this law, such as special permit for utilizing coastal waters and integrated coastal management including application of zonation scheme
- Law Number 32 Year 2014 regarding maritime. Derivative regulations under this law are now being developed, such as maritime surveillance, management and harmonization among marine stakeholders including provisions for constructing coastal and offshore structures/buildings in order to maintain the quality of the environment
- Law Number 7 Year 2016 regarding protection and empowerment of fishermen, aquaculturists, and salt farmers. Derivative regulations are being developed under this law, such as insurance, credit and loan, and limiting the importation of fishery products
- Government Regulation Number 60 Year 2007 regarding conservation of fishery resources. In this aspect, the Indonesian Government is targeting to establish 20 million ha of MPAs around the country
- Ministerial Decree Number 47 Year 2016 regarding potency estimation, total allowable catch, and utilization rate of fishery resources in the Fisheries Management Areas of Indonesia
- Ministerial Decree Number 75-85 Year 2016 establishment of fisheries management plan
COMPLIANCE TO INTERNATIONAL LAWS
- Presidential Regulation Number 9 Year 2007 on ratification of the agreement with the Indian Ocean Tuna Commission (IOTC)
- Presidential Regulation Number 109 Year 2007 on ratification of the Convention for the Conservation of Southern Bluefin Tuna (CCSBT)
- Presidential Regulation Number 61 Year 2013 on ratification of the Convention on the Conservation and Management of Highly Migratory Fish Stocks in the Western and Central Pacific Ocean (WCPFC)
- Presidential Decree Number 43 Year 1978 on ratification of the Convention on International Trade in Endangered Species of World Fauna and Flora (CITES)
GENDER POLICIES
- Law No. 7 Year 1984 on ratification of the Convention on the Elimination of all Forms of Discrimination Against Women
- Establishment of National Commission on Anti-Violence against Women (KOMNAS Perempuan) through Presidential Decree No. 181 Year 1998, on 9 October 1998, which was reinforced by Presidential Decree No. 65 Year 2005
- Presidential Decree No.9 Year 2000 on Gender Mainstreaming in National Development obliging all Ministries and other governmental institutions to integrate all experiences, aspirations, needs, and problems of gender in the planning, monitoring and evaluation from all policies and activities in all aspects of development
- Circular of Minister of Marine Affairs Number 681/MEN-KP/X/2013 regarding the implementation of Gender Mainstreaming in all marine fisheries activities
REFERENCES
BIG. 2017a. Pentingnya informasi geospasial untuk menata laut Indonesia. Badan Informasi Geospasial. Available at http://www.bakosurtanal.go.id/berita-surta/show/pentingnya-informasi-geospasial-untuk-menata-laut-indonesia. Accessed on 13 March 2017.
BIG. 2017b. BIG serahkan peta NKRI kepada Kemenkokesra Badan Informasi Geospasial. Available at http://www.bakosurtanal.go.id/berita-surta/show/big-serahkan-peta-nkri-kepada-kemenkokesra. Accessed on 13 March 2017.
BPS. 2016a. Pertumbuhan Ekonomi Indonesia Tahun 2015. Badan Pusat Statistik. Available at https://www.bps.go.id/brs/view/id/1267. Accessed on 13 March 2017.
BPS. 2016. Statistik Sektor Perikanan. Badan Pusat Statistik. Available at https://www.bps.go.id/index.php/Subjek/view/56#subjekViewTab4. Accessed on 14 March 2017.
FAO. 2018. Fishery and Aquaculture Country Profiles: The Republic of Indonesia. Food and Agriculture Organization of the United Nations, Fisheries andAquaculture Department. Available at http://www.fao.org/fishery/facp/IDN/en. Accessed on 28 May 2018.
FAOSTAT. 2018. Statistics Division, Food and Agriculture Organization of the United Nations. Available at http://www.fao.org/faostat/en/#country/101. Accessed on 28 May 2018.
KKP. 2015a. Analisis Data Pokok. Pusat Data dan Statistik. Kementerian Kelautan dan Perikanan. Available at http://statistik.kkp.go.id/sidatik-dev/Publikasi/src/analisisdatakkp2015.pdf. Accessed on 13 March 2017.
KKP. 2015b. Analisis Marine and Fisheries in Figures 2015. Pusat Data dan Statistik. Kementerian Kelautan dan Perikanan. Available at http://statistik.kkp.go.id/sidatik-dev/Publikasi/src/kpda2015.pdf. Accessed on 21 March 2017.
KKP. 2016a. Konsumsi Ikan Naik dalam 5 Tahun Terakhir Kementerian Kelautan dan Perikanan. Available http://kkp.go.id/wp-content/uploads/2016/05/Konsumsi-Ikan-Naik-dalam-5-Tahun-Terakhir.pdf. Accessed on 13 March 2017.
KKP. 2016b. KPDA. Pusat Data dan Statistik. Kementerian Kelautan dan Perikanan
MMAF. 2009. Ministry of Marine Affairs and Fisheries. Ministerial Decree of Marine Affairs and Fisheries No.1 year 2009 regarding Fisheries Management Area (WPP RI).
Sukadi, M. F. and Kartamihardja, E.S. 1995. Inland fisheries management of lakes and reservoirs with multiple uses in Indonesia. Regional Symposium on sustainable development of inland fi sheries under environmental constraints, Bangkok, Thailand, 19-21 October 1994, FAO, UN.